Metrics > Kubernetes
Kubernetes Overview Dashboard
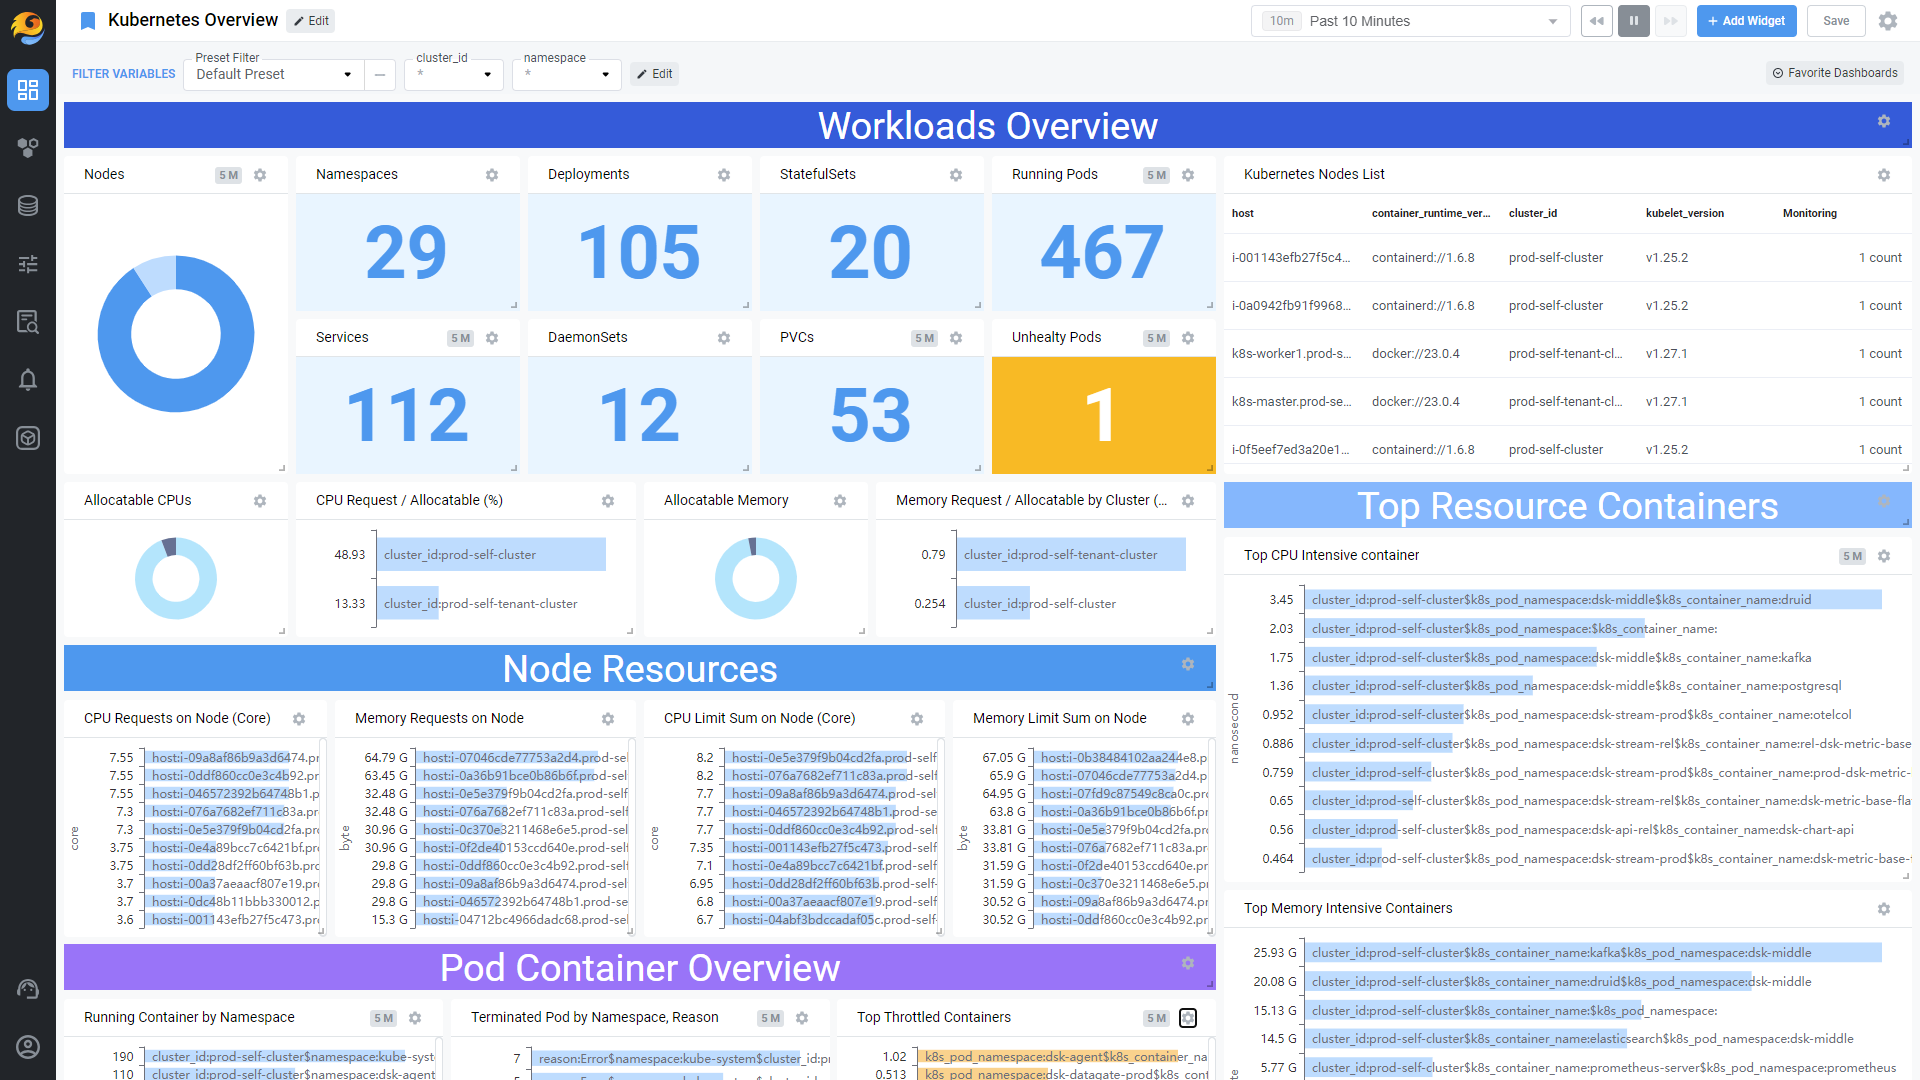
Widget Type | Widget Title | Summary |
Workloads Summary | Nodes | 클러스터에 속한 노드 수량을 표시합니다. |
Namespaces | 클러스터에 속한 네임스페이스 수량을 표시합니다. | |
Deployments | 클러스터에 속한 디플로이먼트 수량을 표시합니다. | |
StatefulSets | 클러스터에 속한 스테이트풀셋 수량을 표시합니다. | |
Running Pods | 클러스터에 속한 Running 상태의 파드 수량을 표시합니다. | |
Services | 클러스터에 속한 서비스 수량을 표시합니다. | |
DaemonSets | 클러스터에 속한 데몬셋 수량을 표시합니다. | |
PVCs | 클러스터에 속한 PVC 수량을 표시합니다. | |
Unhealty Pods | 클러스터에 속한 Running 상태가 아닌 파드 수량을 표시합니다. | |
Nodes Summary | Kubernetes Nodes List | 클러스터에 속한 노드의 정보를 표시합니다. |
Cluster Resources | Allocatable CPUs | 할당 가능한 CPU Core 수량을 표시합니다. |
CPU request vs allocatable (%) | 전체 할당 가능한 CPU 대비 어느정도의 Request가 할당되었는지 표시합니다. | |
Allocatable Memory | 할당 가능한 Memory 용량을 표시합니다. | |
Memory request vs allocatable (%) | 전체 할당 가능한 메모리 대비 어느정도의 Request가 할당되었는지 표시합니다. | |
Pod Container Resources | Top CPU Intensive container | CPU 사용량이 높은 순으로 컨테이너들을 표시합니다. |
Top Memory Intensive Containers | Memory 사용량이 높은 순으로 컨테이너들을 표시합니다. | |
Node Resources | CPU/Memory Requests on Node | 클러스터에 각 노드의 CPU 또는 메모리 Request 양을 표시합니다. |
CPU/Memory Limit Sum on Node | 클러스터에 각 노드의 CPU 또는 메모리 제한을 표시합니다. | |
Pod Container Summary | Running Container by Namespace | 각 네임스페이스의 할당된 파드의 수를 높은 순으로 표시합니다. |
Terminated Pod by Namespace, Reason | 지정된 시간 동안 종료된 파드의 수를 네임스페이스 별로, 종료 이유와 함게 표시합니다. | |
Top Throttled Containers | 쓰로틀링 시간이 높은 순으로 컨테이너를 표시합니다. 너무 높은 수치가 표시되면 CPU 자원 또는 Limit 할당량이 충분한지 확인해야 합니다. |
[1] Workloads Summary
1. Nodes
각 클러스터에 속한 노드의 수를 확인할 수 있습니다.
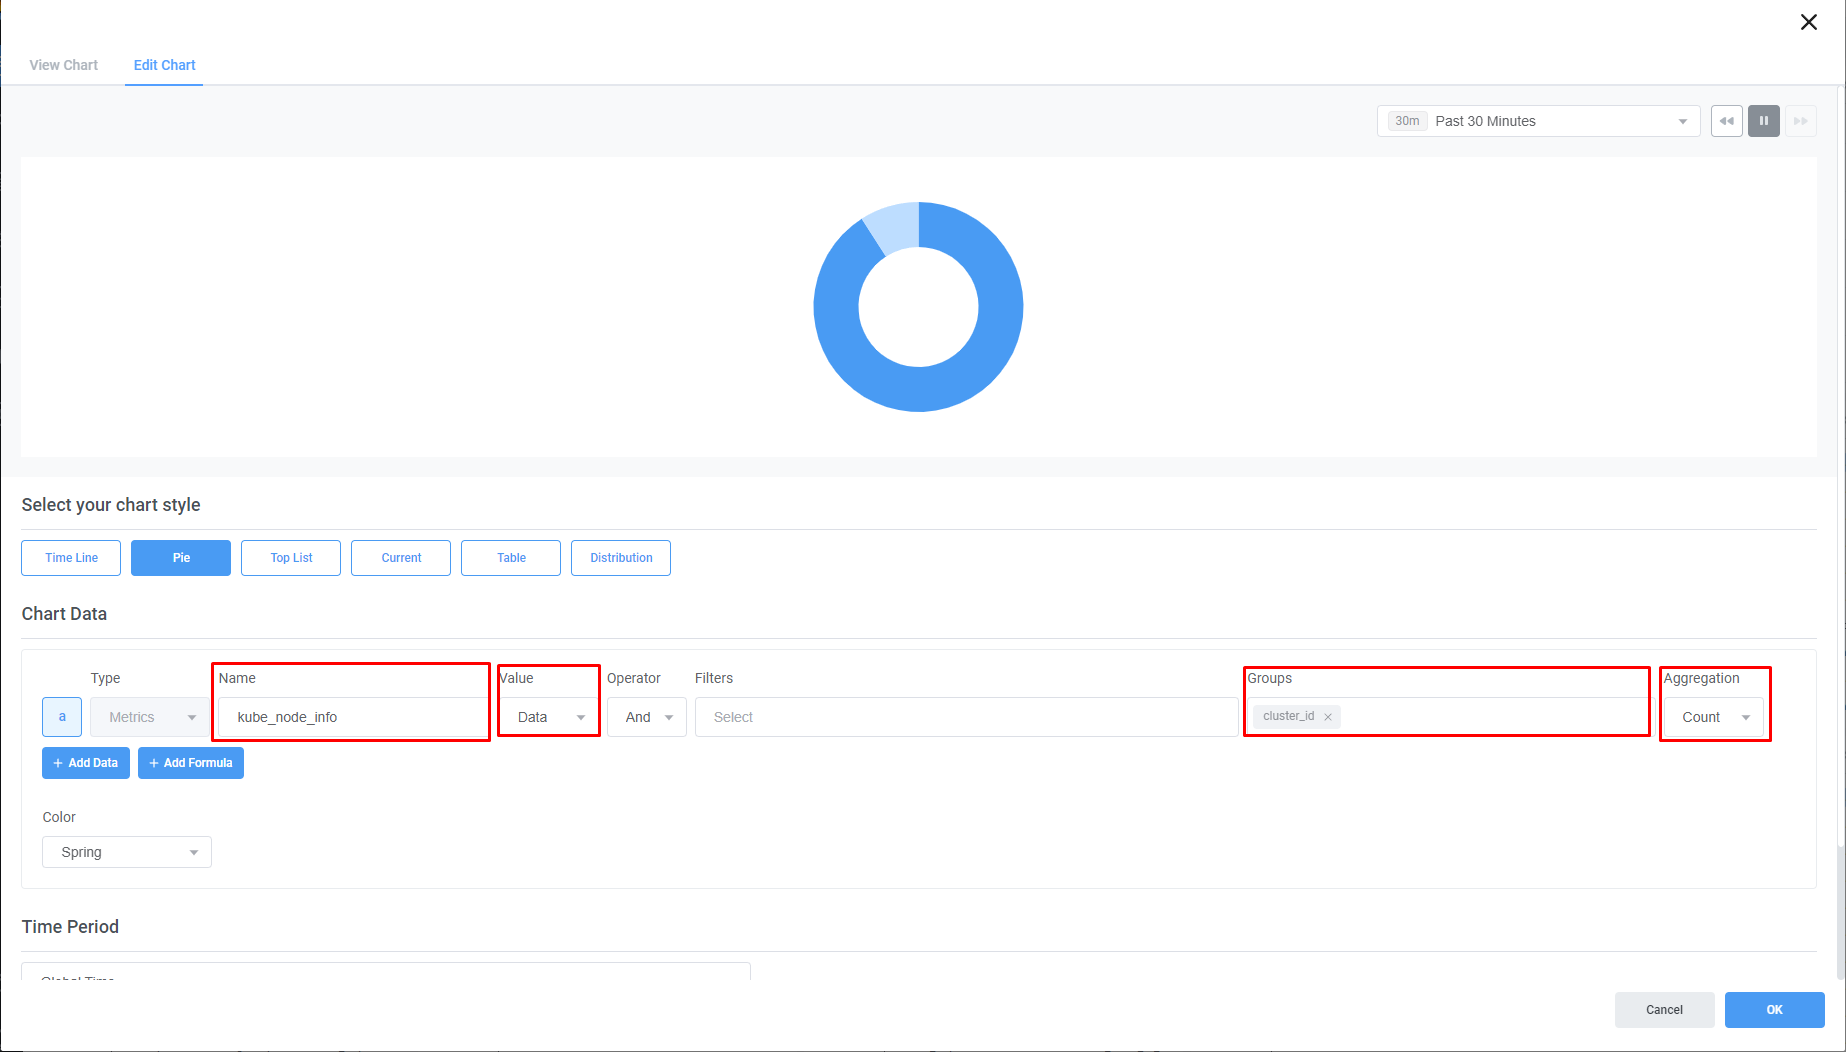
Dashboard 구성
Chart | Pie | |
Type | Metrics |
|
Value | Data or Last | |
Groups | cluster_id | |
Aggregation | Count |
Dashboard 에서 사용한 Metric
Metric Name | kube_node_info |
Type | Guage |
Description | kube_node_info 메트릭은 다음을 추적하는 데 사용할 수 있습니다:클러스터 내 노드의 상태 및 가용성.클러스터의 노드에서 사용 가능한 리소스.클러스터 내 노드의 상태. |
Labels |
|
2. Namespaces
클러스터에 속한 네임스페이스의 수량을 확인할 수 있습니다.
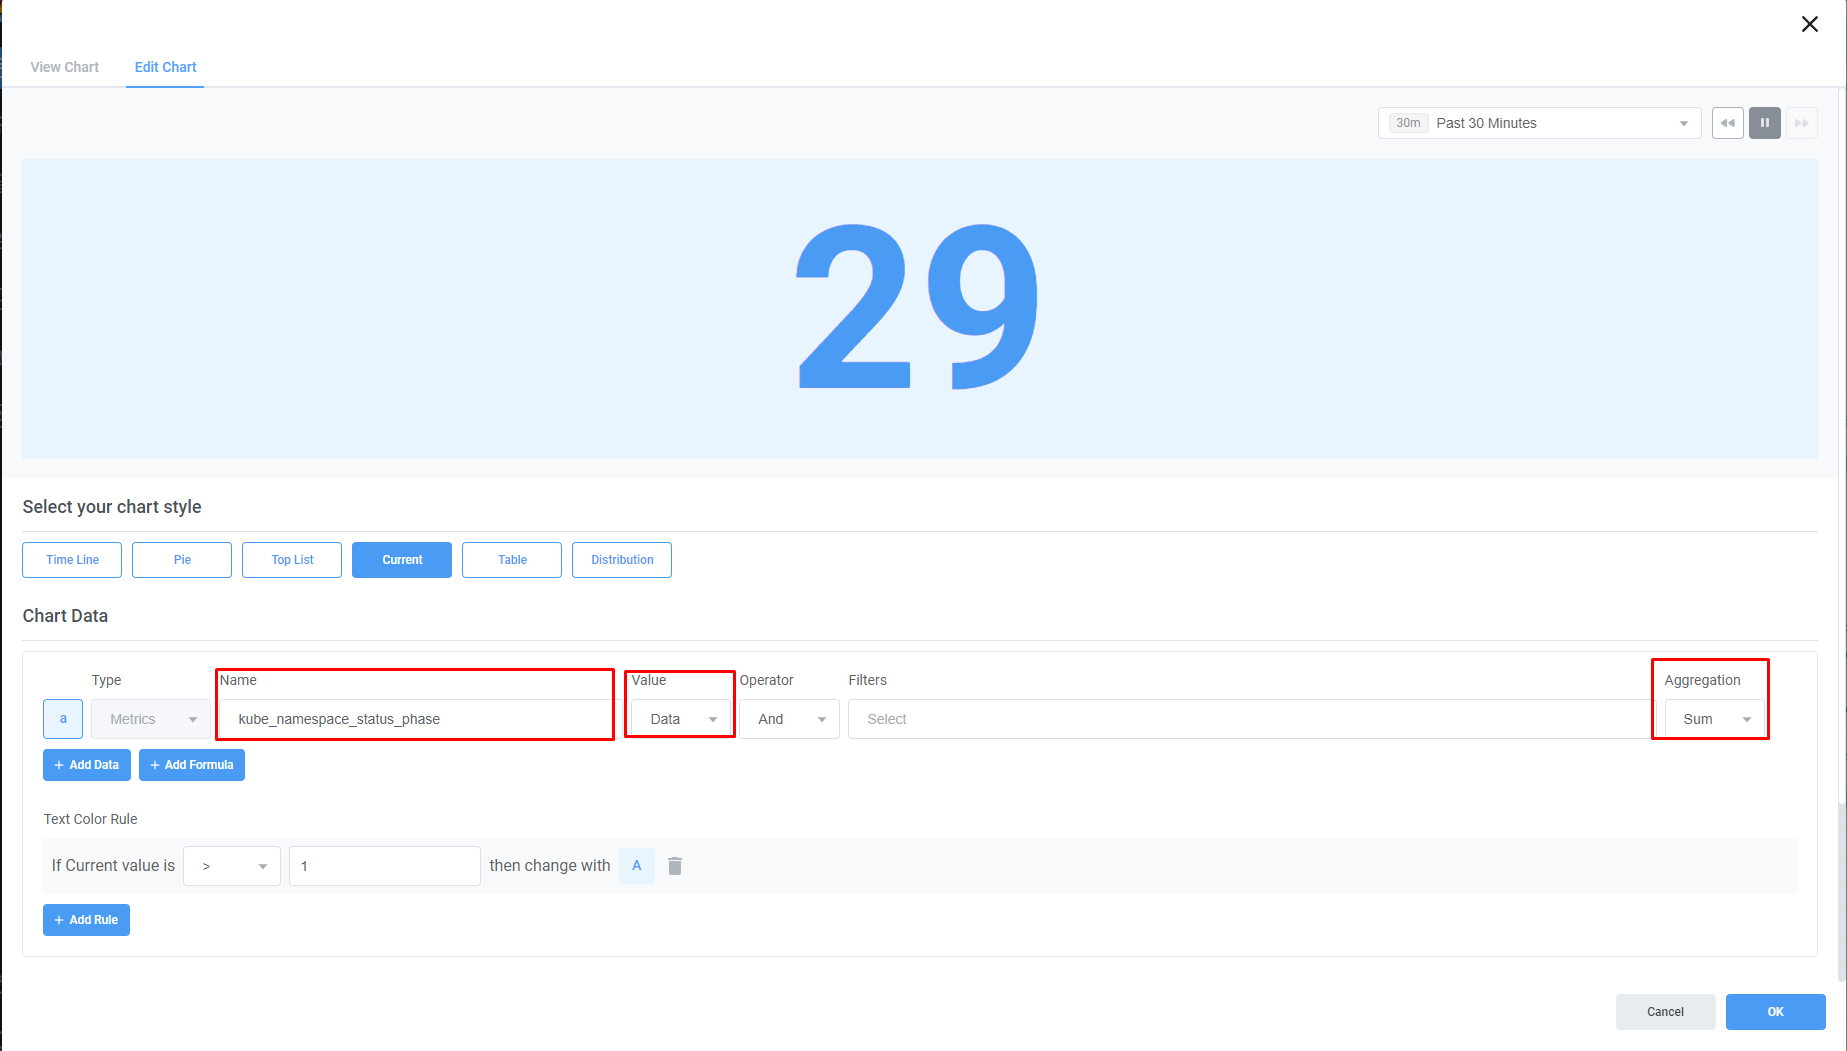
Dashboard 구성
Chart | Current | |
Type | Metrics |
|
Value | Data or Last | |
Aggregation | Sum |
Dashboard 에서 사용한 Metric
Metric Name | kube_namespace_status_phase |
Type | Guage |
Description | 쿠버네티스 namespace 의 상태를 표현하는 메트릭 [Active. Terminating] |
Labels |
|
3. Deployments
클러스터에 속한 디플로이먼트의 수량을 확인할 수 있습니다.
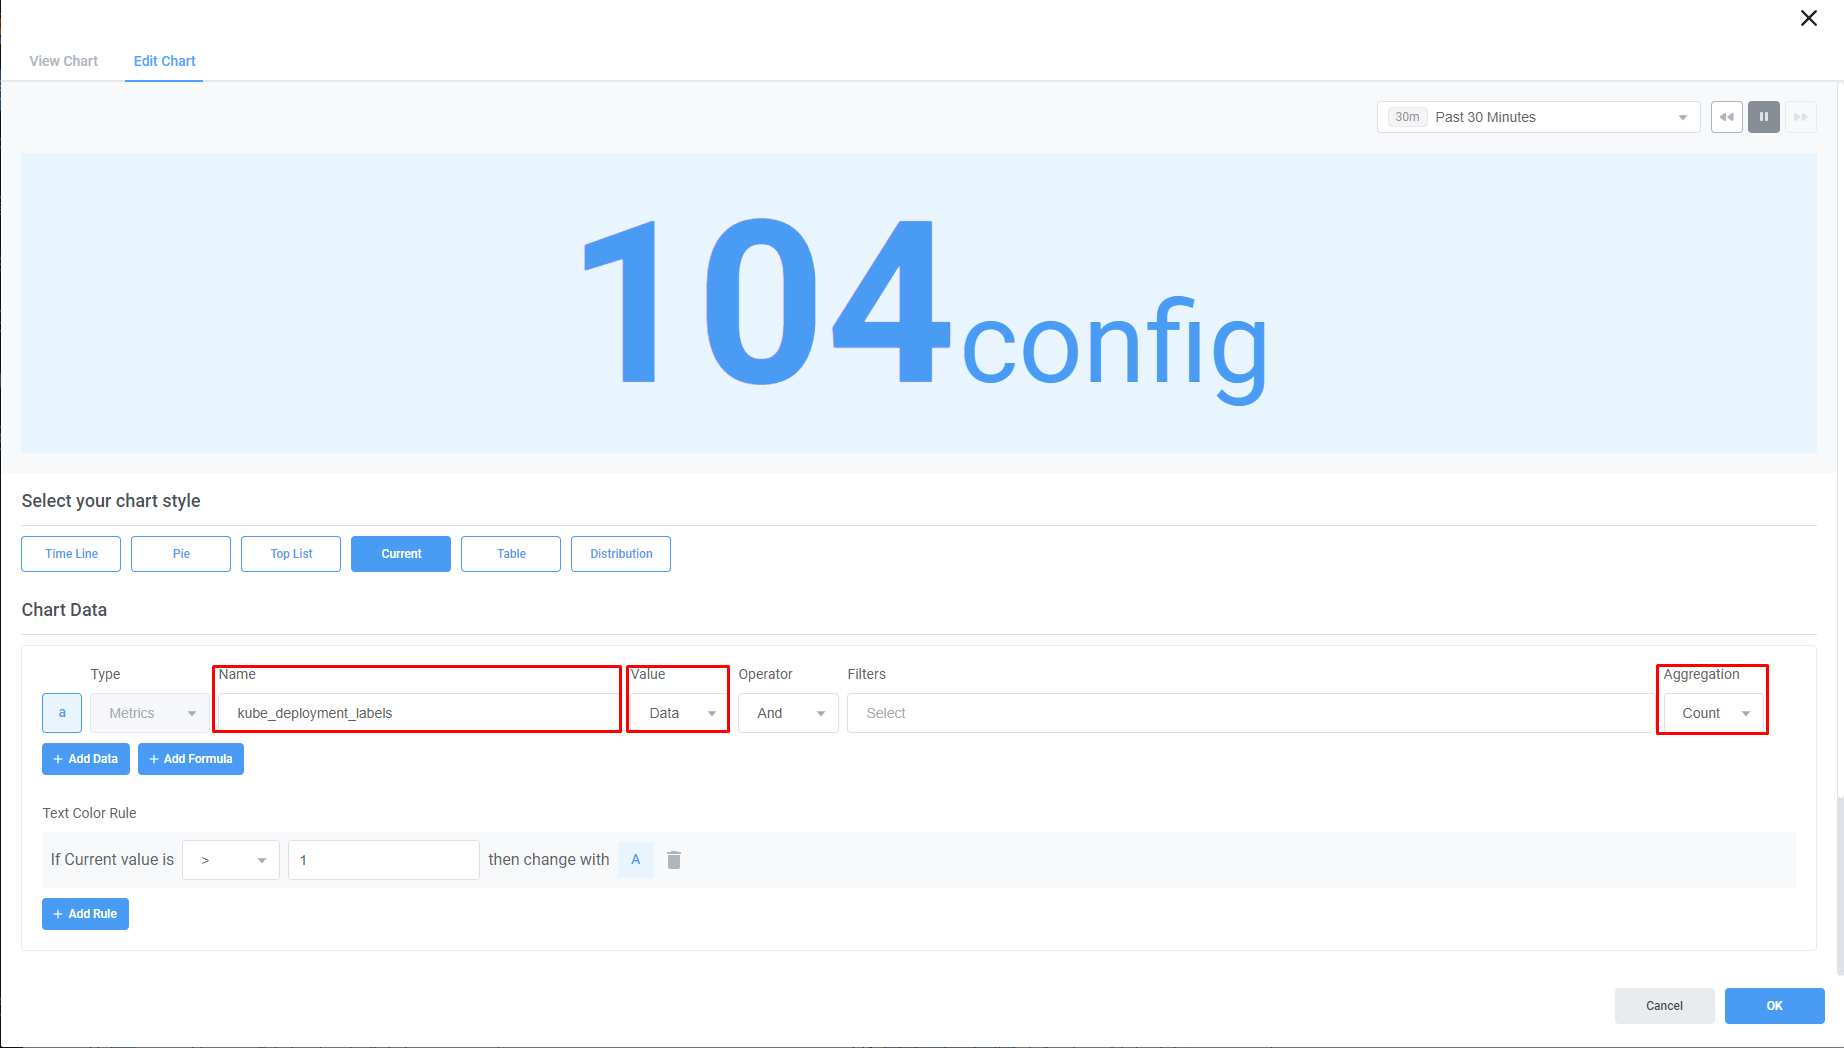
Dashboard 구성
Chart | Current | |
Type | Metrics |
|
Value | Data or Last | |
Aggregation | Count |
Dashboard 에서 사용한 Metric
Metric Name | kube_deployment_labels |
Type | Guage |
Description | deployment에서 선언한 label정보로 수집 되는 값은 1 |
Labels |
|
4. StatefulSets
클러스터에 속한 스테이트풀셋의 수량을 확인할 수 있습니다.
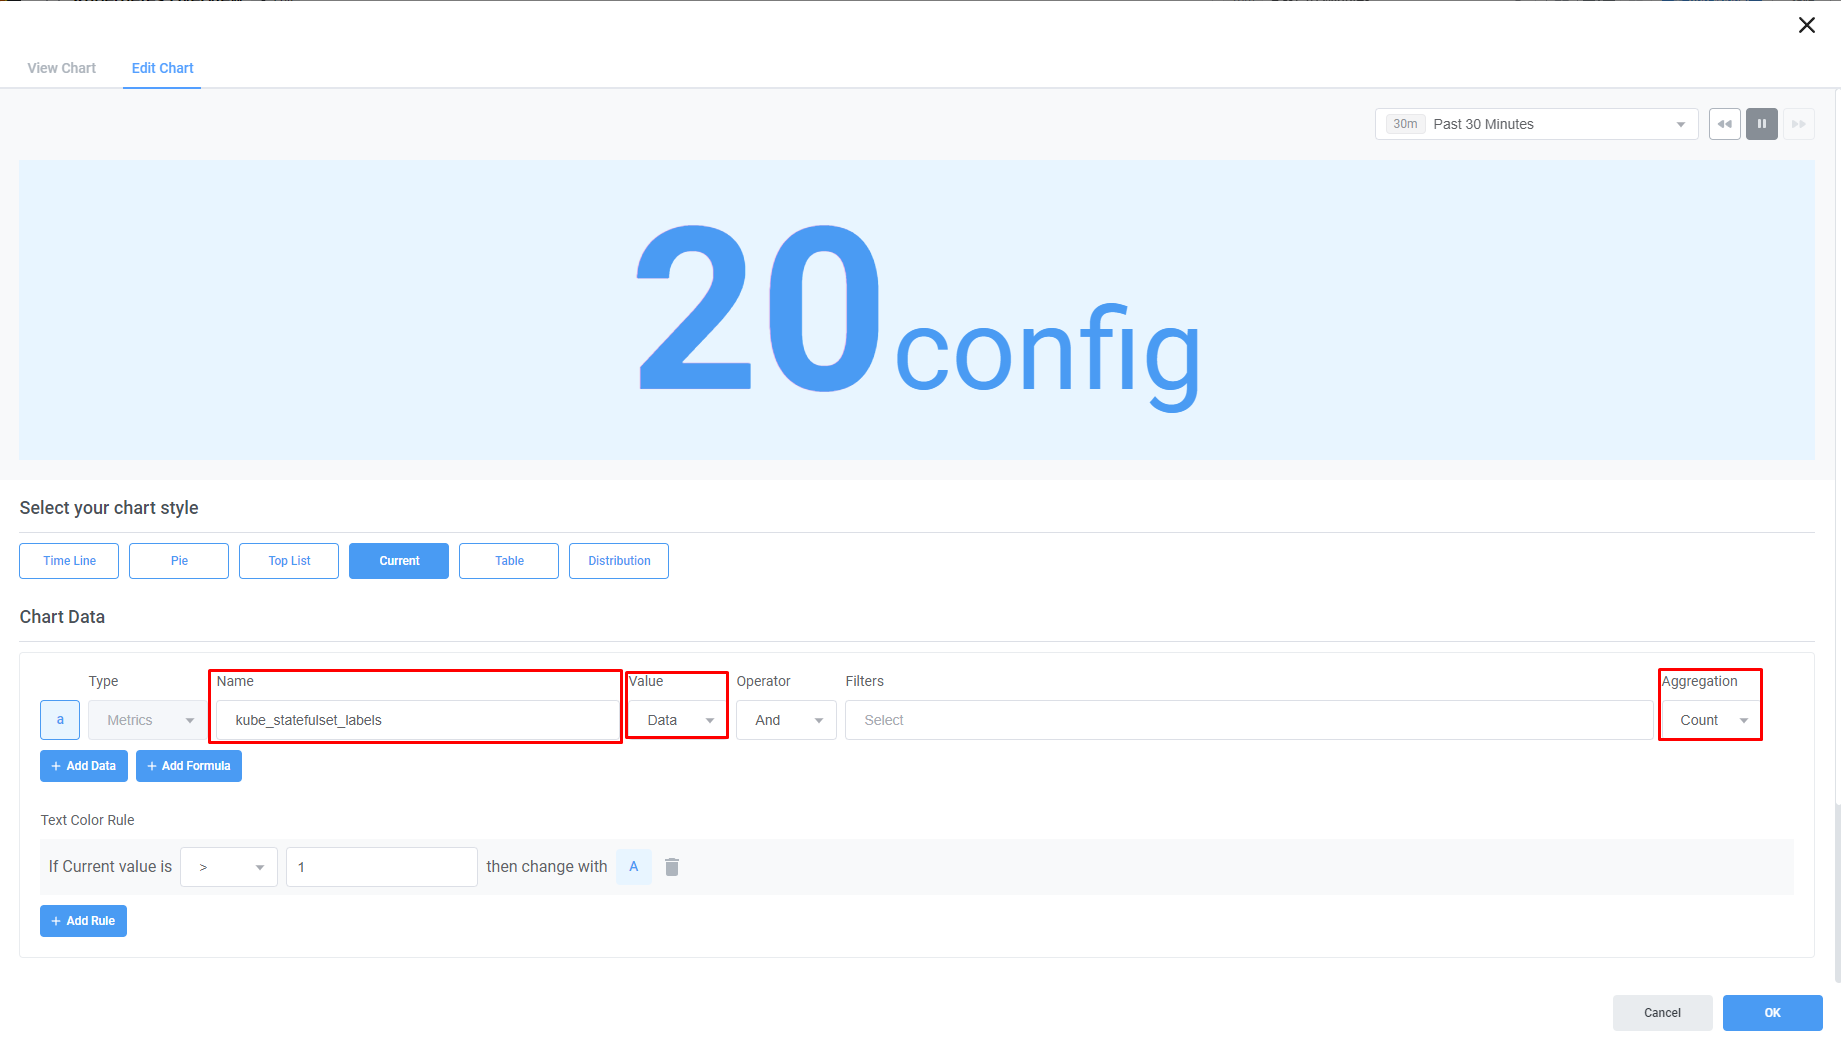
Dashboard 구성
Chart | Current | |
Type | Metrics |
|
Value | Data or Last | |
Aggregation | Count |
Dashboard 에서 사용한 Metric
Metric Name | kube_statefulset_labels |
Type | Guage |
Description | Kubernetes 클러스터에서 StatefulSet 에 설정된 Label을 추적하는 지표. Label 은 Kubernetes 개체에 연결할 수 있는 키-값 쌍입니다. |
Labels |
|
5. Services
클러스터에 속한 서비스의 수량을 확인할 수 있습니다.
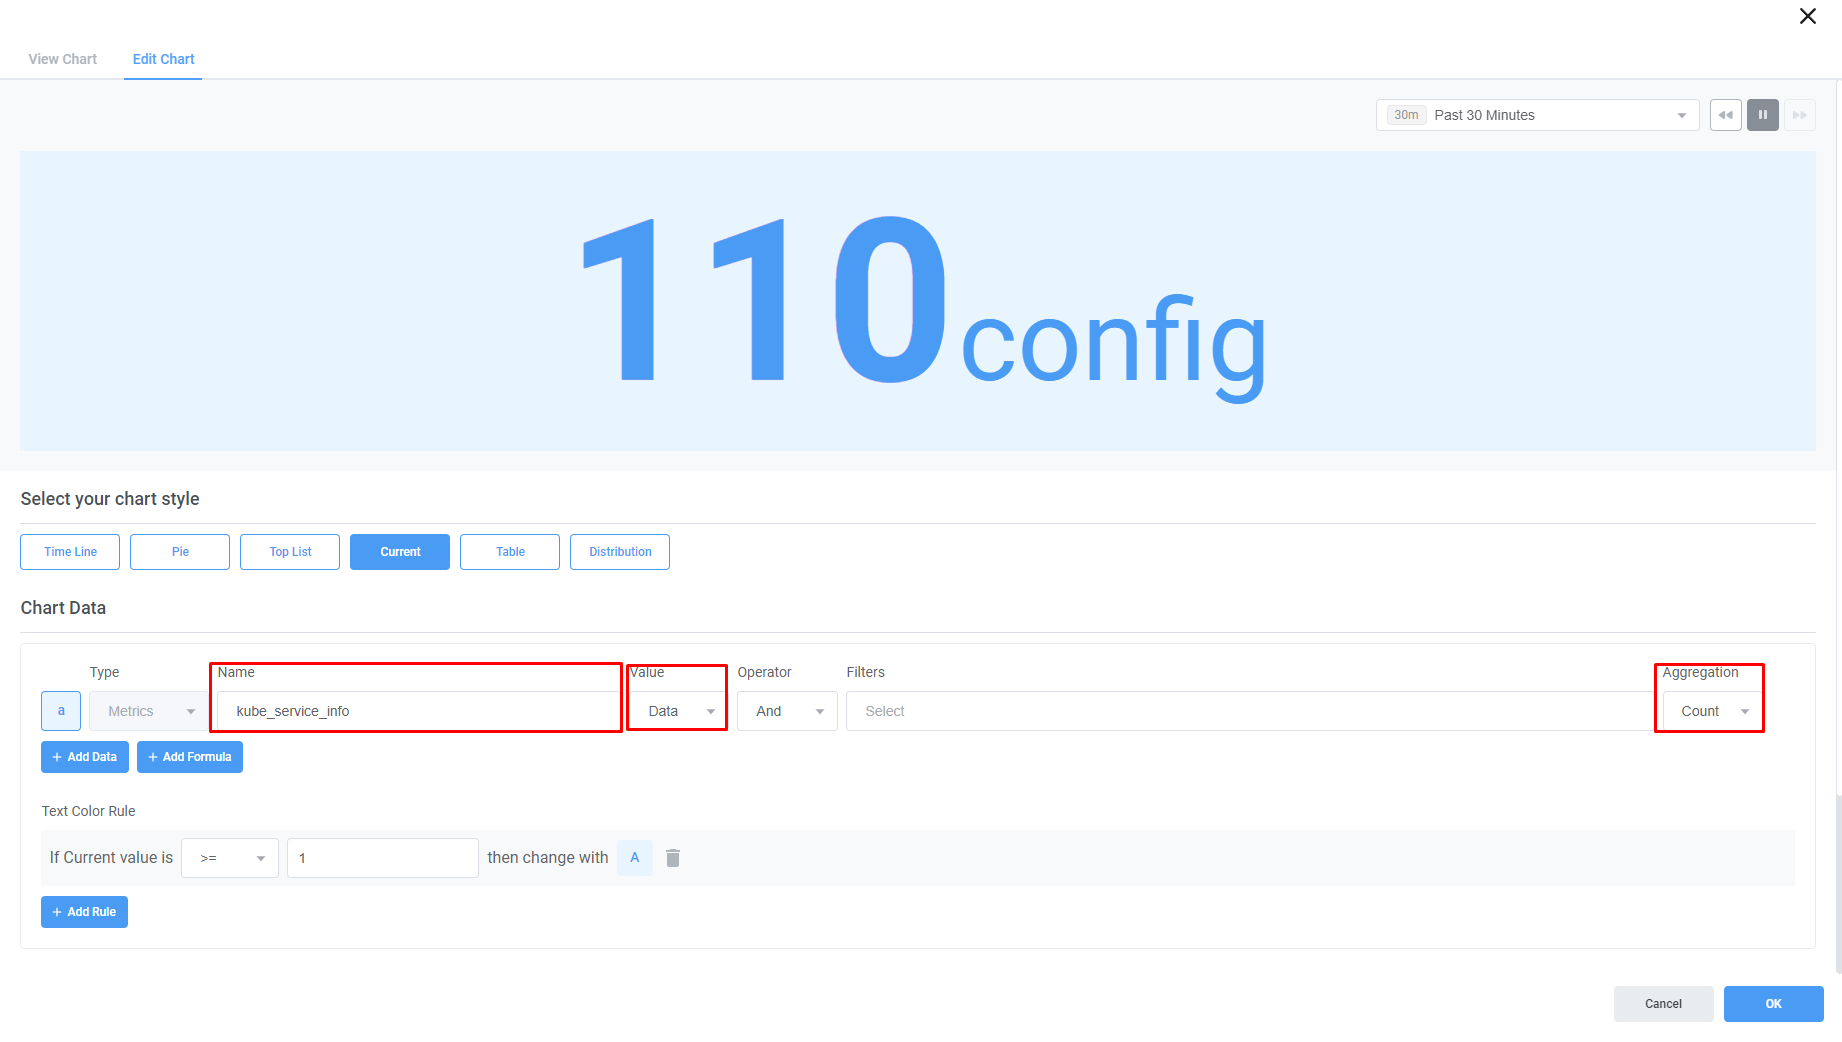
Dashboard 구성
Chart | Current | |
Type | Metrics |
|
Value | Data or Last | |
Aggregation | Count |
Dashboard 에서 사용한 Metric
Metric Name | kube_service_info |
Type | Guage |
Description | deployment에서 선언한 label정보로 수집 되는 값은 1임 |
Labels |
|
6. DaemonSets
클러스터에 속한 데몬셋의 수량을 확인할 수 있습니다.
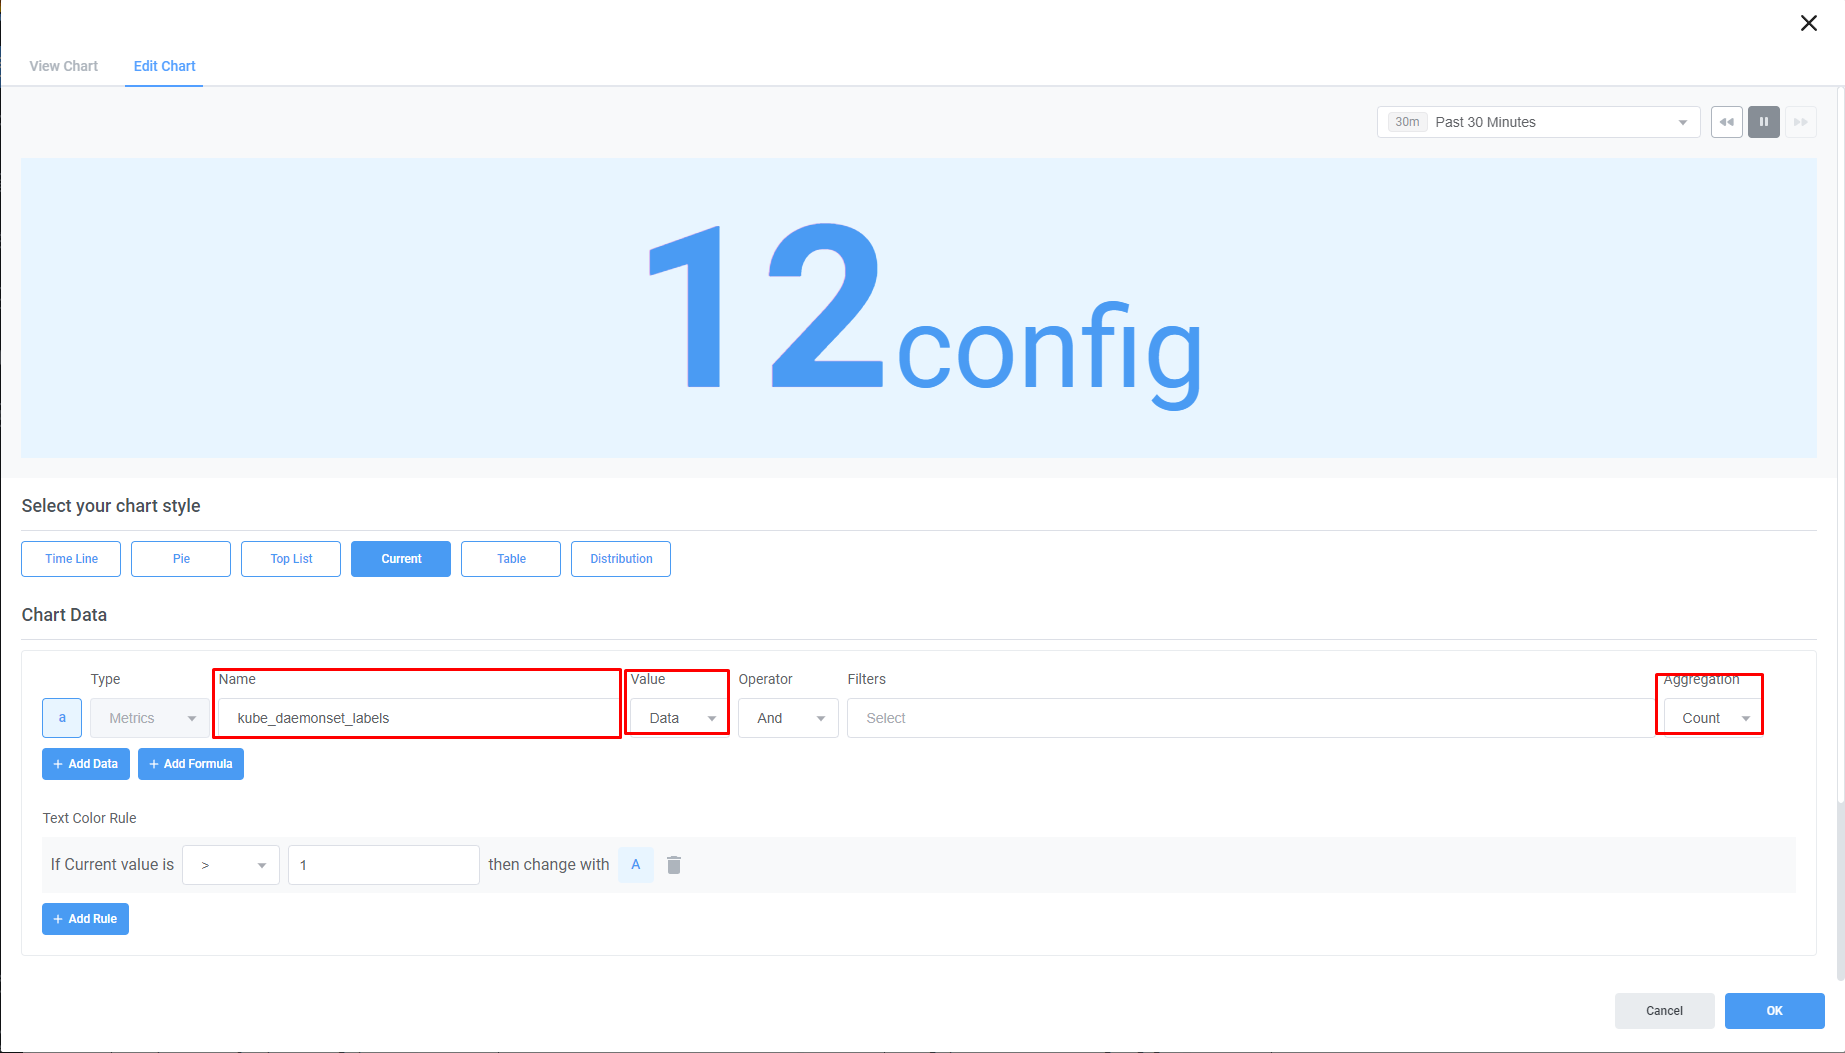
Dashboard 구성
Chart | Current | |
Type | Metrics |
|
Value | Data or Last | |
Aggregation | Count |
Dashboard 에서 사용한 Metric
Metric Name | kube_daemonset_labels |
Type | Guage |
Description | daemonset의 spec.selector.matchLabels 필드의 값을 나타냅니다 |
Labels |
|
7. PVCs
클러스터에 속한 PersistentVolumeClaim의 수량을 확인할 수 있습니다.
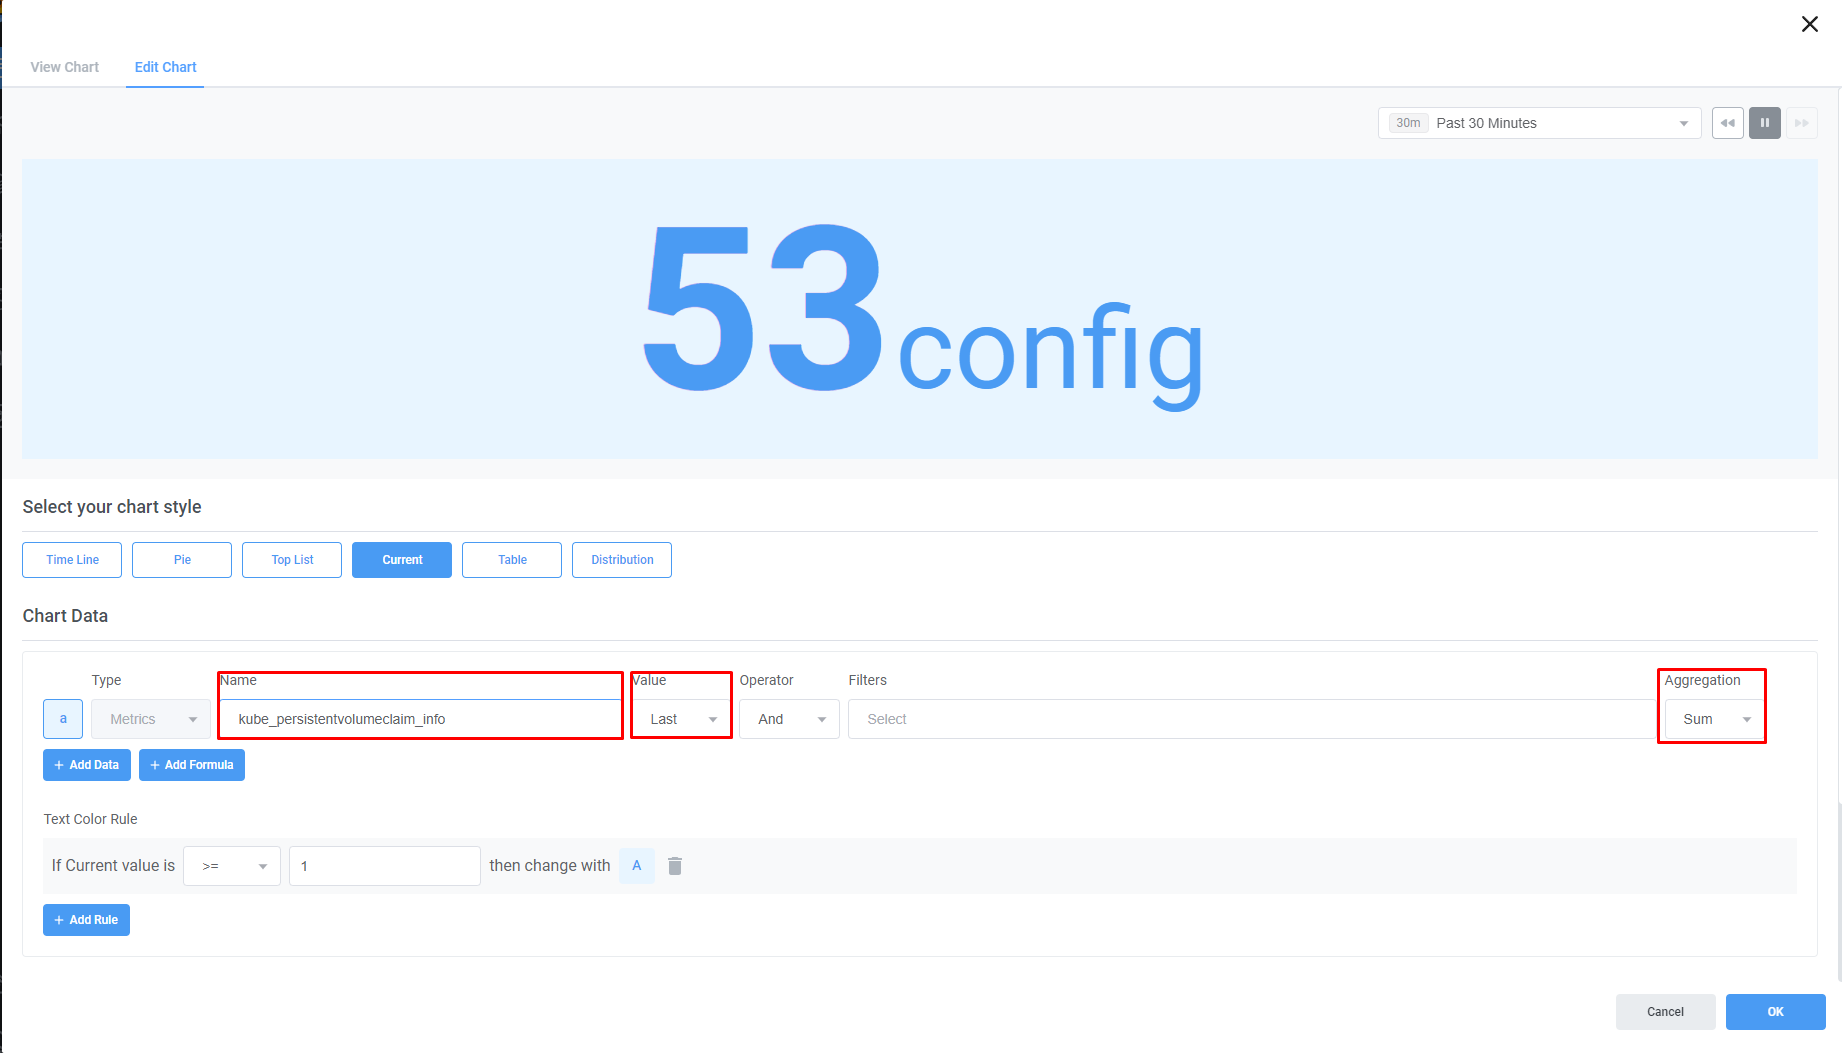
Dashboard 구성
Chart | Current | |
Type | Metrics |
|
Value | Data or Last | |
Aggregation | Count or Sum |
Dashboard 에서 사용한 Metric
Metric Name | kube_persistentvolumeclaim_info |
Type | Guage |
Description | persistentvolumeclaim 에 대한 정보 |
Labels |
|
8. Running Pods
클러스터에 속한 실행중인 파드의 개수를 표시합니다.
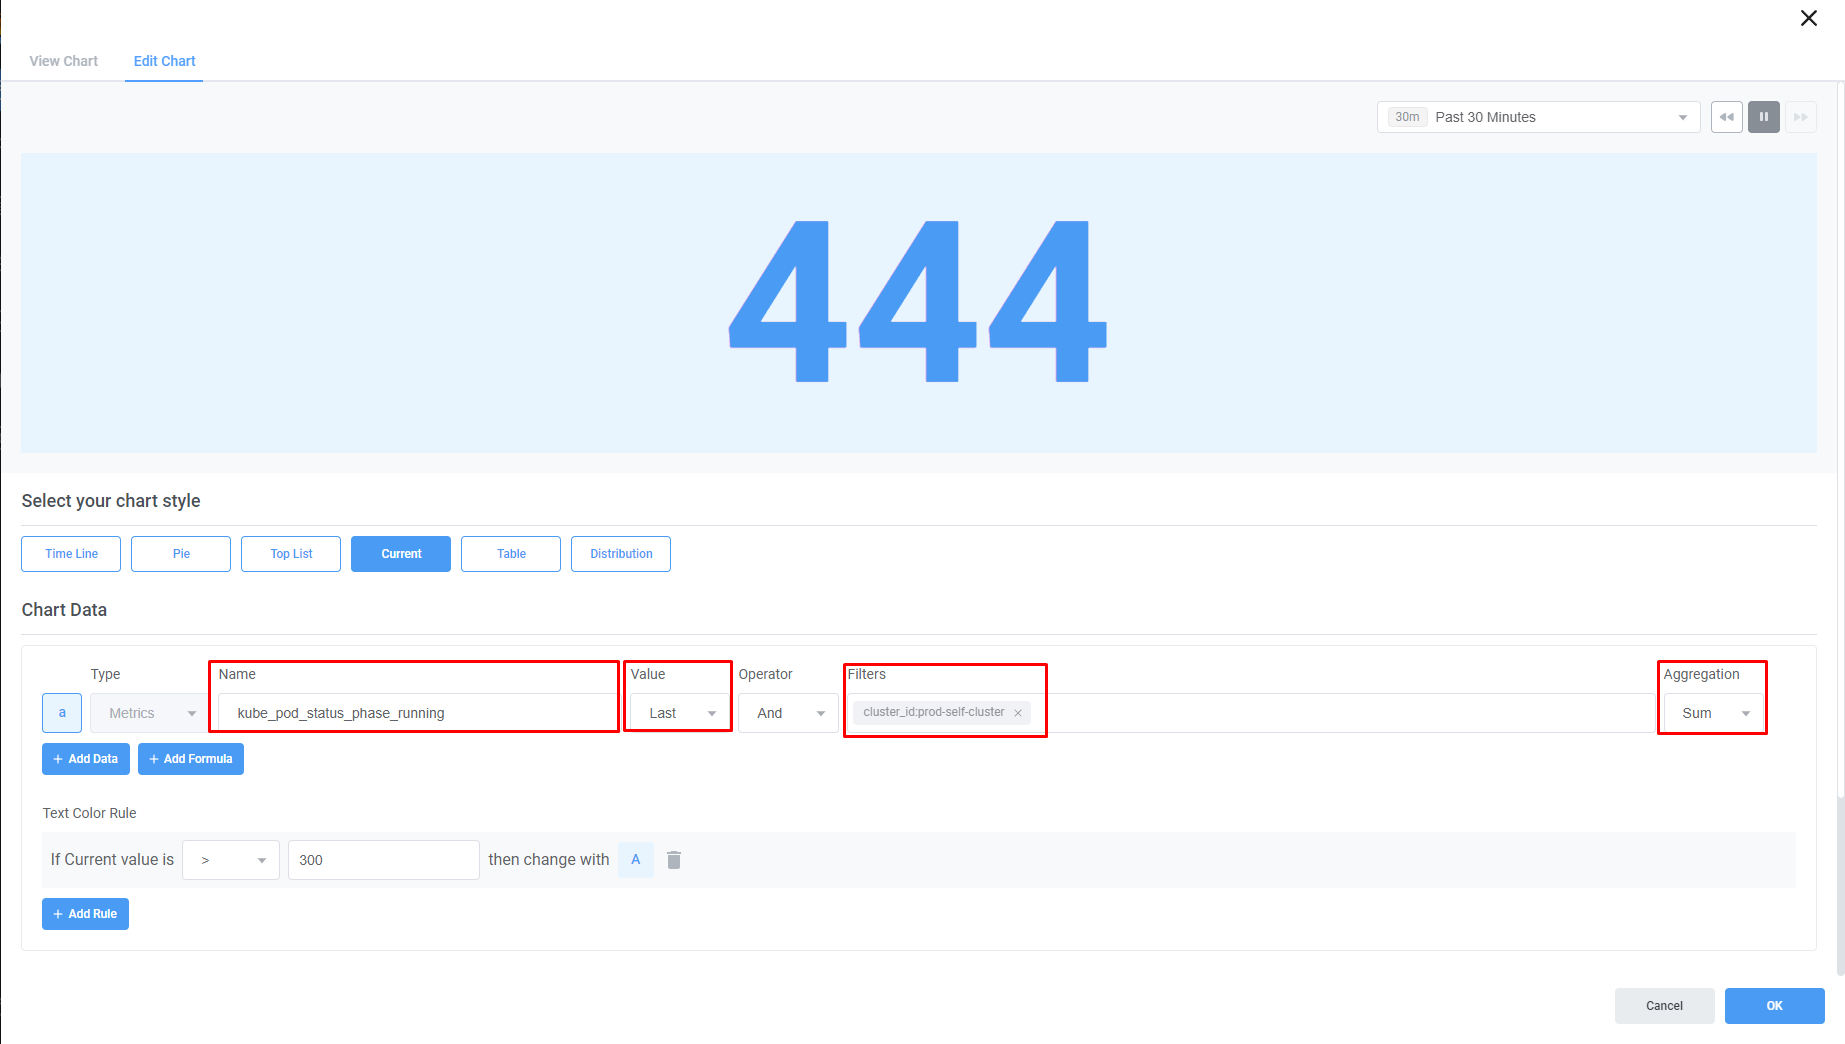
Dashboard 구성
Chart | Current | |
Type | Metrics |
|
Value | Data or Last | |
Filters |
| |
Aggregation | Count or Sum |
Dashboard 에서 사용한 Metric
Metric Name | kube_pod_status_phase_running |
Type | Guage |
Description | Pod가 현재 실행 중임을 나타냅니다. 포드가 성공적으로 예약되었으며 해당 컨테이너가 현재 지정된 작업을 실행 및 수행하고 있음을 나타냅니다. |
Labels |
|
9. Unhealty Pods
클러스터에 속한 실행 중인 파드 중 정상적으로 실행되지 않는 것들의 개수를 표시합니다.
Dashboard 구성
Chart | Current | |
Type | Metrics |
|
Value | Data or Last | |
Aggregation | Sum |
Dashboard 에서 사용한 Metric
Metric Name | kube_pod_status_phase_pending |
Type | Guage |
Description | 파드가 Pending 상태임을 나타내는 지표 |
Labels |
|
Metric Name | kube_pod_status_phase_failed |
Type | Guage |
Description | Pod에 오류가 발생하여 원하는 상태에 도달하거나 성공적으로 완료할 수 없음을 나타내는 Kubernetes의 상태 조건이며, 포드 단계는 포드 수명 주기의 현재 상태를 나타냅니다. |
Labels |
|
Metric Name | kube_pod_status_phase_unknown |
Type | Guage |
Description | Pod의 phase가 Unknown이면 1, 아니면 0의 값을 가집니다. |
Labels |
|
[2] Nodes Summary
1. Kubernetes Nodes List
클러스터에 속한 노드들의 정보를 확인할 수 있습니다.
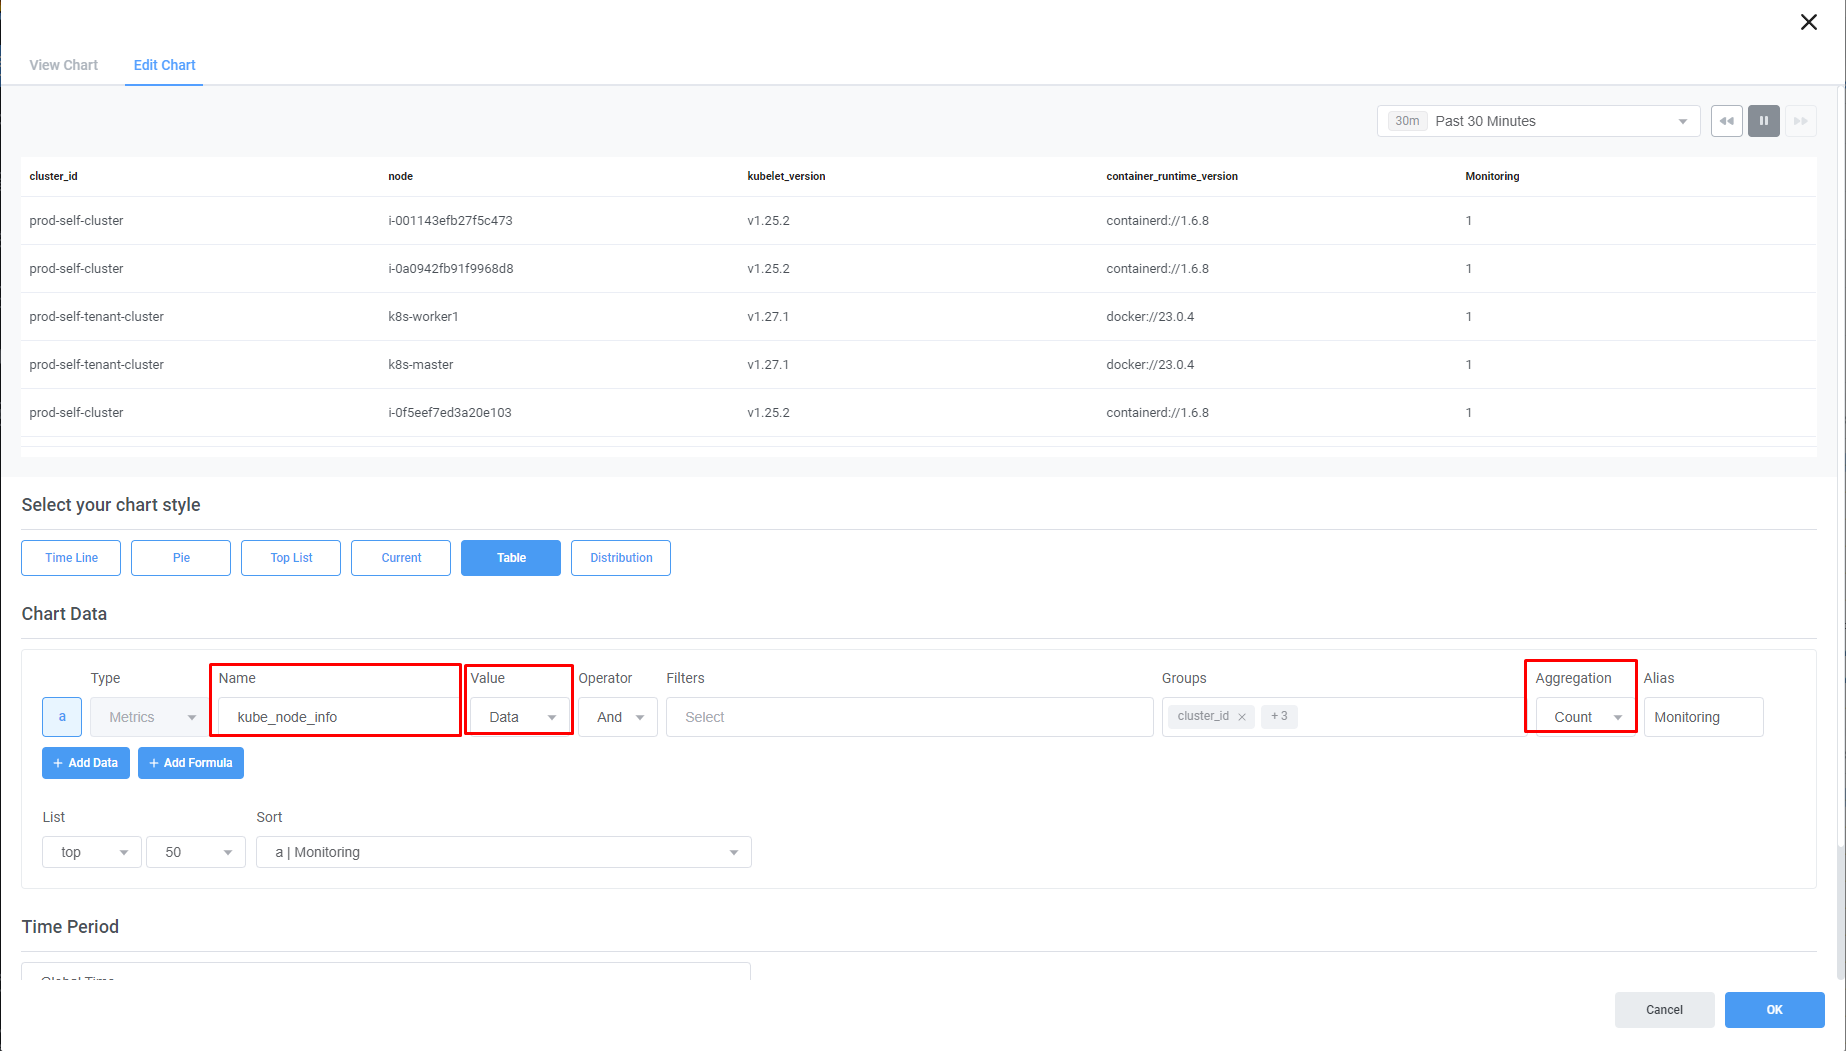
Dashboard 구성
Chart | Table | |
Type | Metrics |
|
Value | Data or Last | |
Groups |
| |
Aggregation | Count |
Dashboard 에서 사용한 Metric
Metric Name | kube_node_info |
Type | Gauge |
Description | kube_node_info 메트릭은 다음을 추적하는 데 사용할 수 있습니다:클러스터 내 노드의 상태 및 가용성.클러스터의 노드에서 사용 가능한 리소스.클러스터 내 노드의 상태. |
Labels |
|
[3] Nodes Summary
1. Allocatable CPUs
각 클러스터에 속한 노드들의 수량을 확인할 수 있습니다.
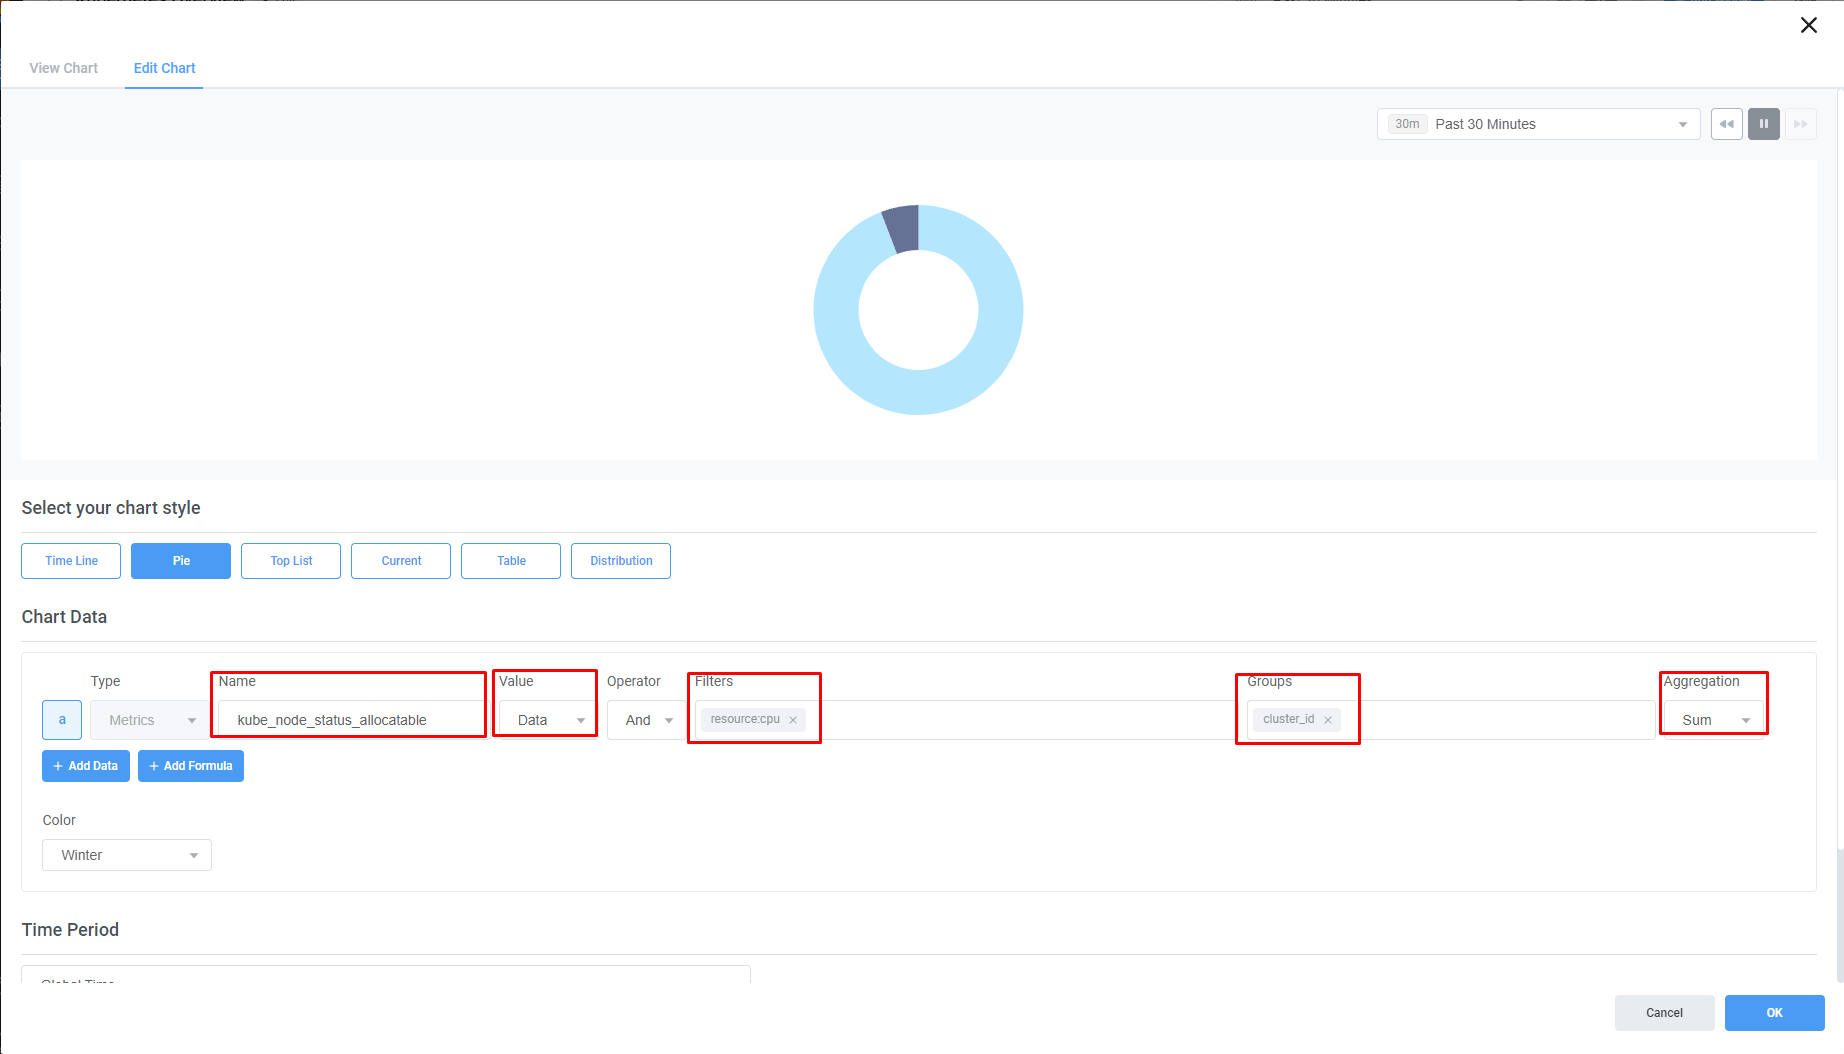
Dashboard 구성
Chart | Pie | |
Type | Metrics |
|
Value | Data or Last | |
Filters |
| |
Groups |
| |
Aggregation | Sum |
Dashboard 에서 사용한 Metric
Metric Name | kube_node_status_allocatable |
Type | Gauge |
Description | 노드에서 파드에 사용할 수 있는 리소스를 추적합니다. |
Labels |
|
2. CPU Request / Allocatable (%)
클러스터에 속한 노드들의 정보를 확인할 수 있습니다.
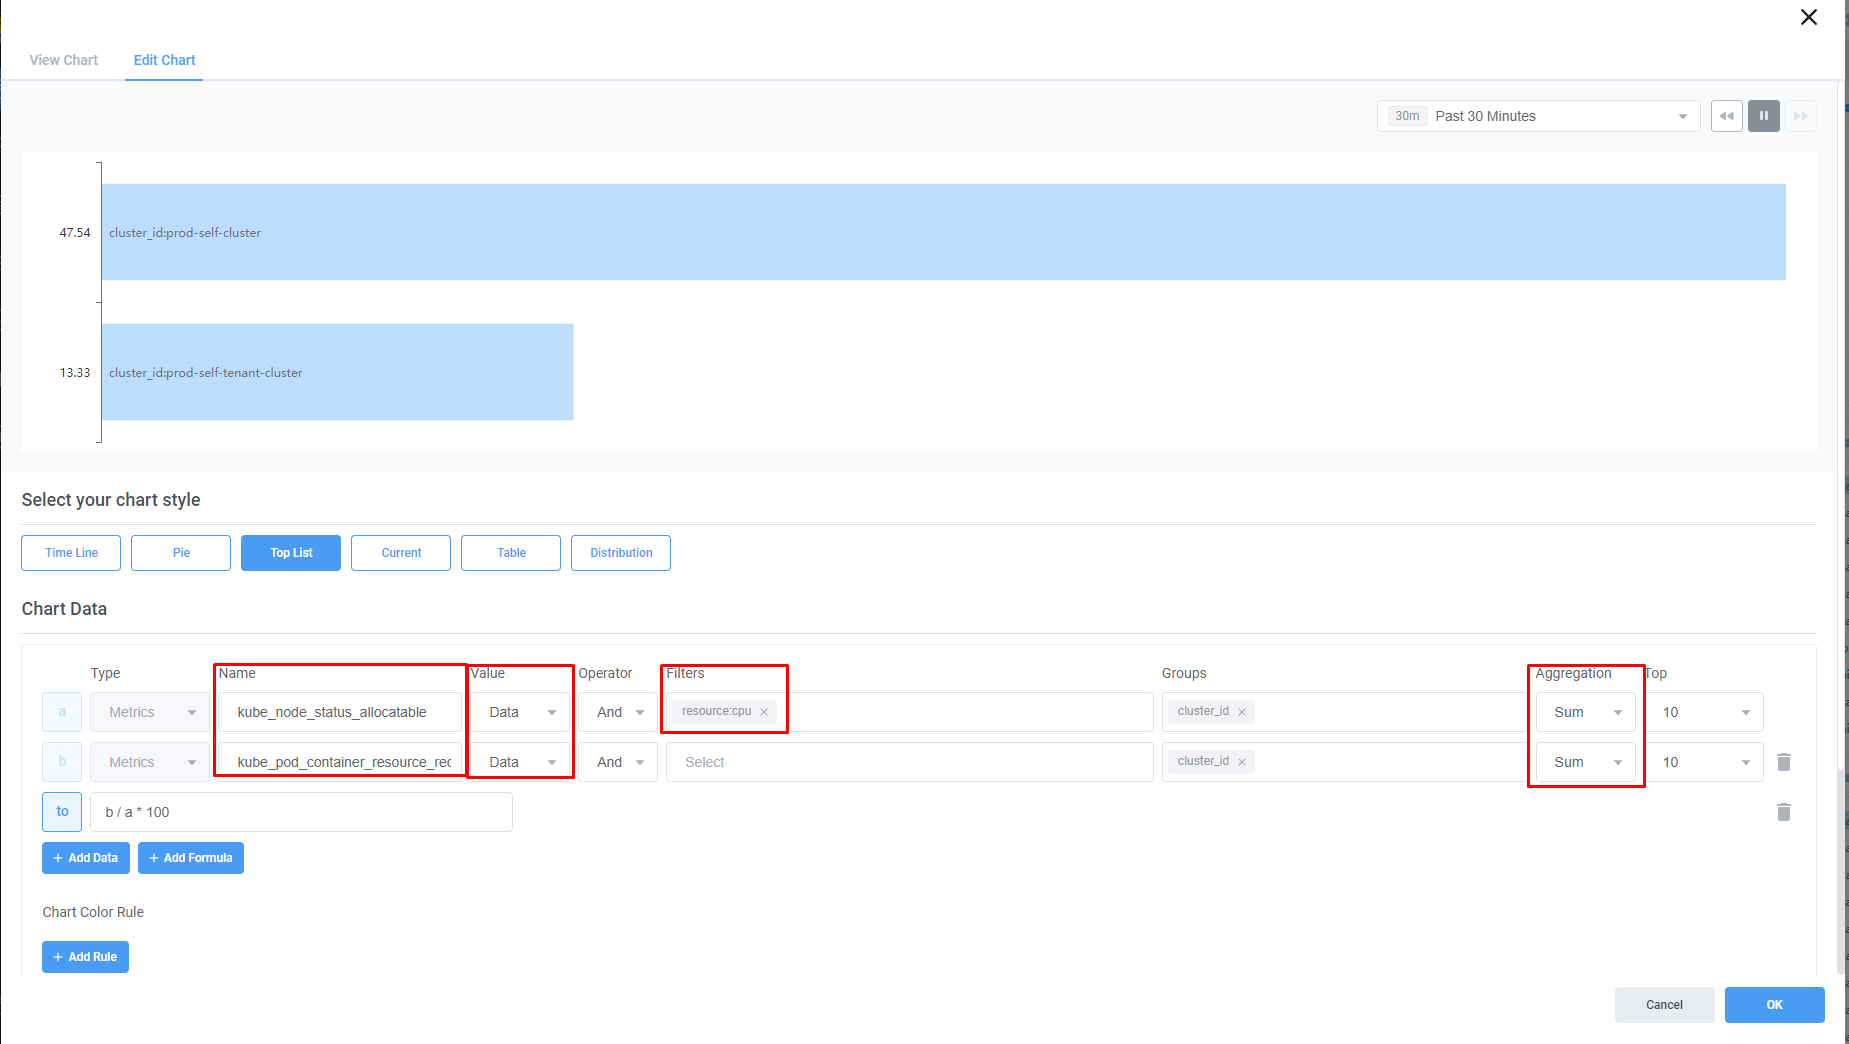
Dashboard 구성
Chart | Top List | |
Type | Metrics |
|
Value | Data or Last | |
Filters |
| |
Groups |
| |
Aggregation | Sum |
Dashboard 에서 사용한 Metric
Metric Name | kube_node_status_allocatable |
Type | Gauge |
Description | 노드에서 파드에 사용할 수 있는 리소스를 의미합니다. |
Labels |
|
Metric Name | kube_pod_container_resource_requests_cpu |
Type | Gauge |
Description | 컨테이너가 요청하는 CPU 리소스의 양입니다. |
Labels |
|
3. Allocatable Memory
클러스터에 속한 노드들의 정보를 확인할 수 있습니다.
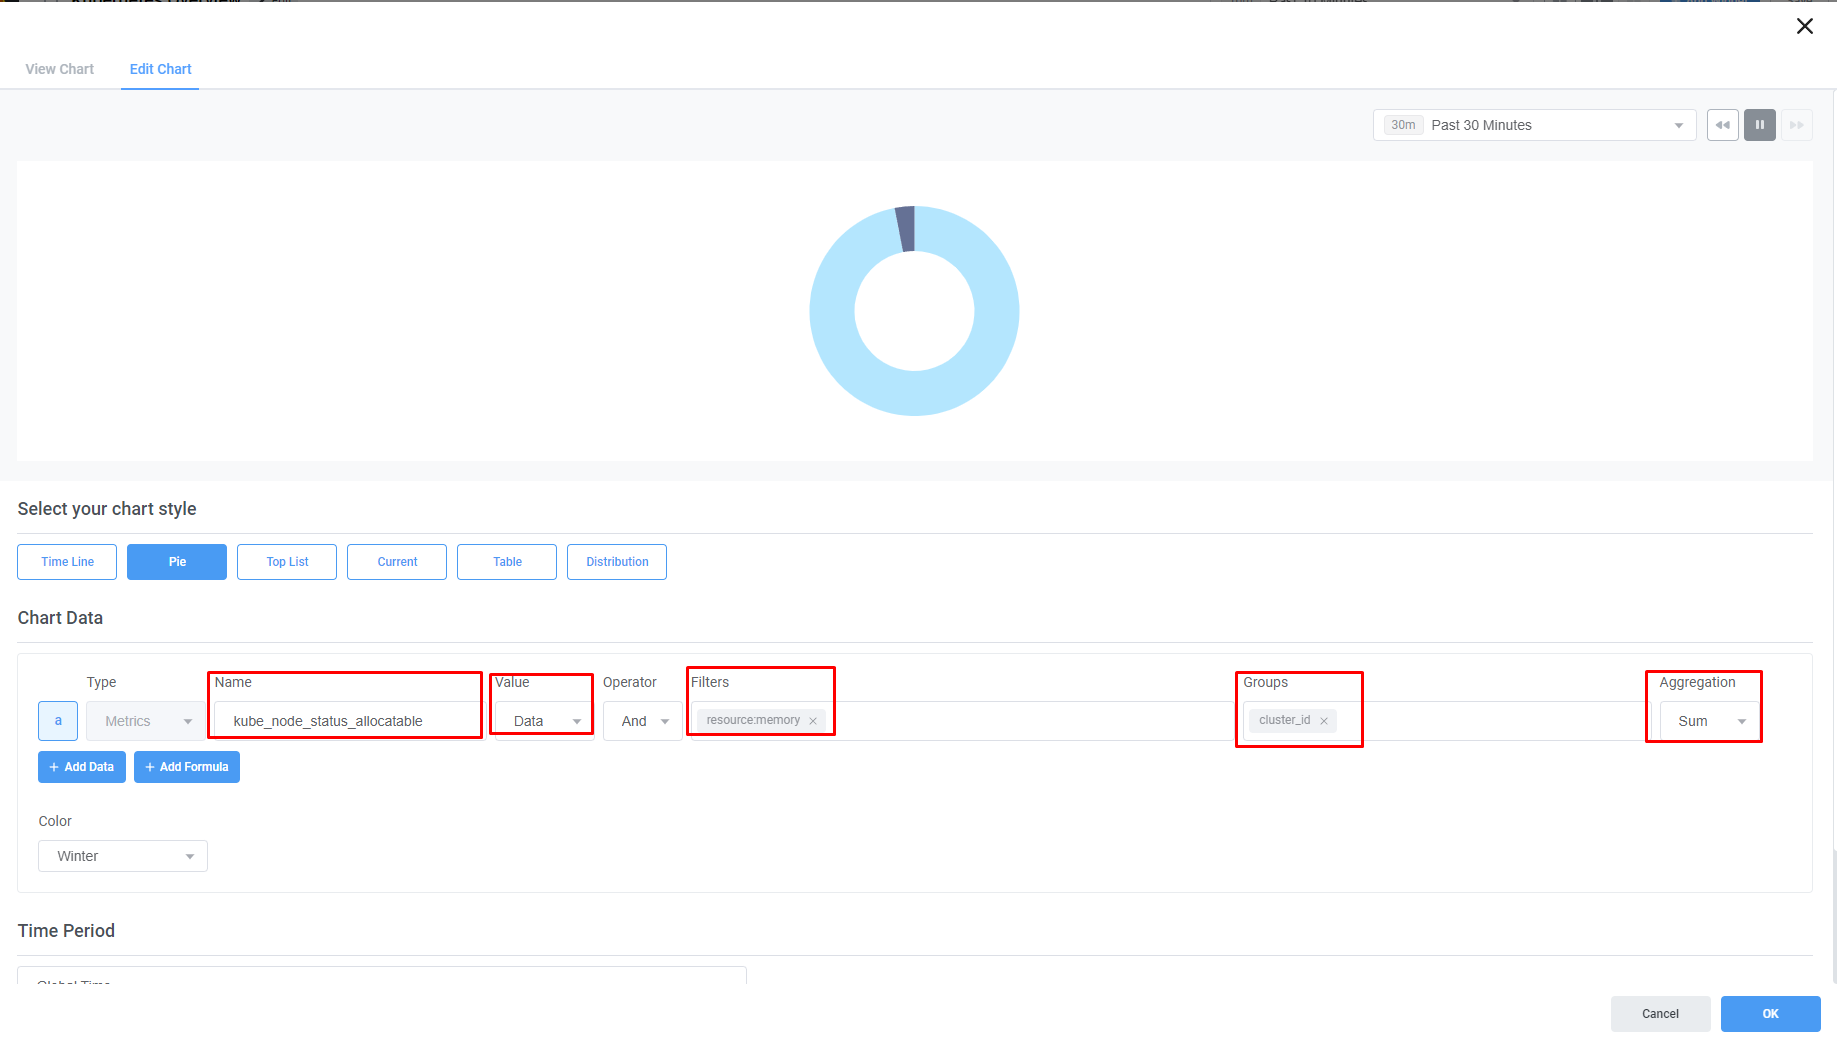
Dashboard 구성
Chart | Pie | |
Type | Metrics |
|
Value | Data or Last | |
Filters |
| |
Groups |
| |
Aggregation | Sum |
Dashboard 에서 사용한 Metric
Metric Name | kube_node_status_allocatable |
Type | Gauge |
Description | 노드에서 파드에 사용할 수 있는 리소스를 의미합니다. |
Labels |
|
4. Memory request vs allocatable (%)
클러스터에 속한 노드들의 정보를 확인할 수 있습니다.
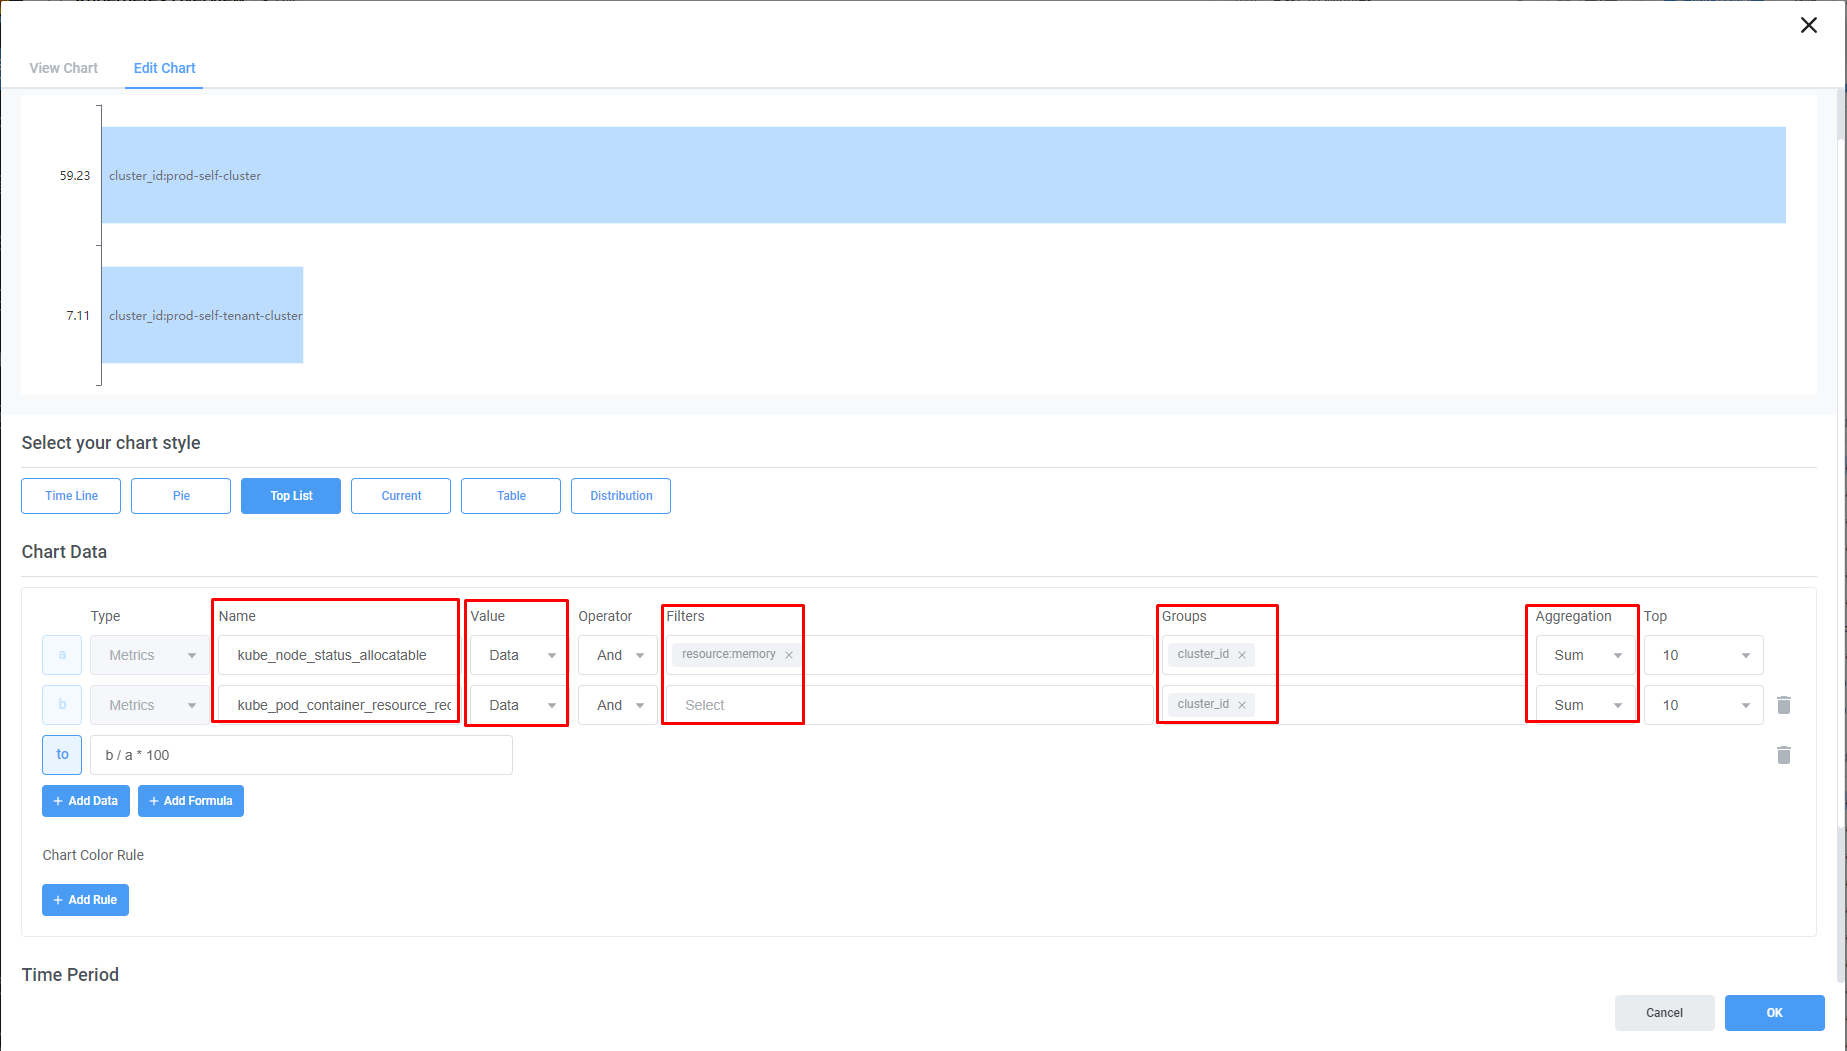
Dashboard 구성
Chart | Top List | |
Type | Metrics |
|
Value | Data or Last | |
Filters |
| |
Groups |
| |
Aggregation | Sum |
Dashboard 에서 사용한 Metric
Metric Name | kube_node_status_allocatable |
Type | Gauge |
Description | 노드에서 파드에 사용할 수 있는 리소스를 의미합니다. |
Labels |
|
Metric Name | kube_pod_container_resource_requests_memory |
Type | Gauge |
Description | 컨테이너가 요청하는 Memory 리소스의 양입니다. |
Labels |
|
[4] Nodes Resources
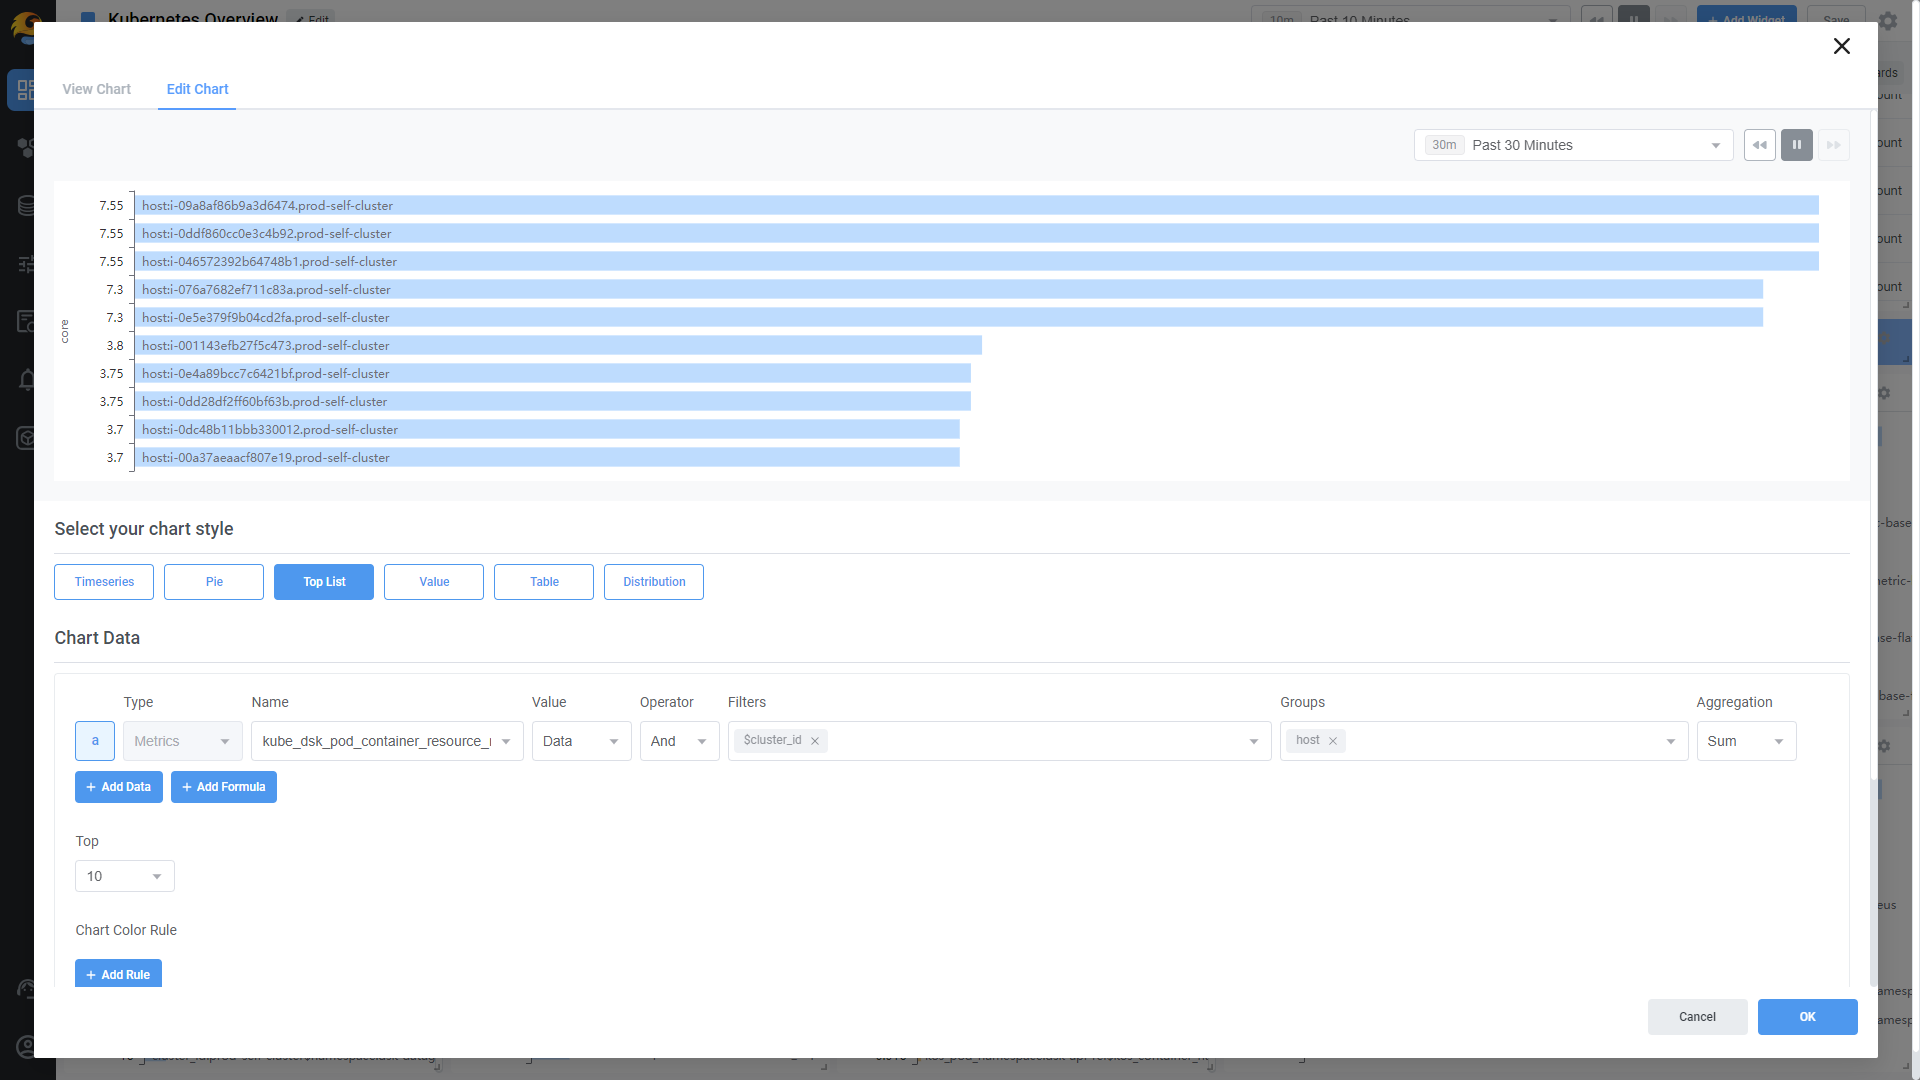
1. CPU Requests on Node (Core)
클러스터에 있는 각각의 노드에 부여된 CPU 리소스 Request를 표시합니다.

Dashboard 구성
Chart | Top List | |
Type | Metrics |
|
Value | Data or Last | |
Filters |
| |
Groups |
| |
Aggregation | Sum |
Dashboard 에서 사용한 Metric
Metric Name | kube_dsk_pod_container_resource_requests_cpu |
Type | Gauge |
Description | 컨테이너가 요청하는 CPU 리소스의 양입니다. |
Labels |
|
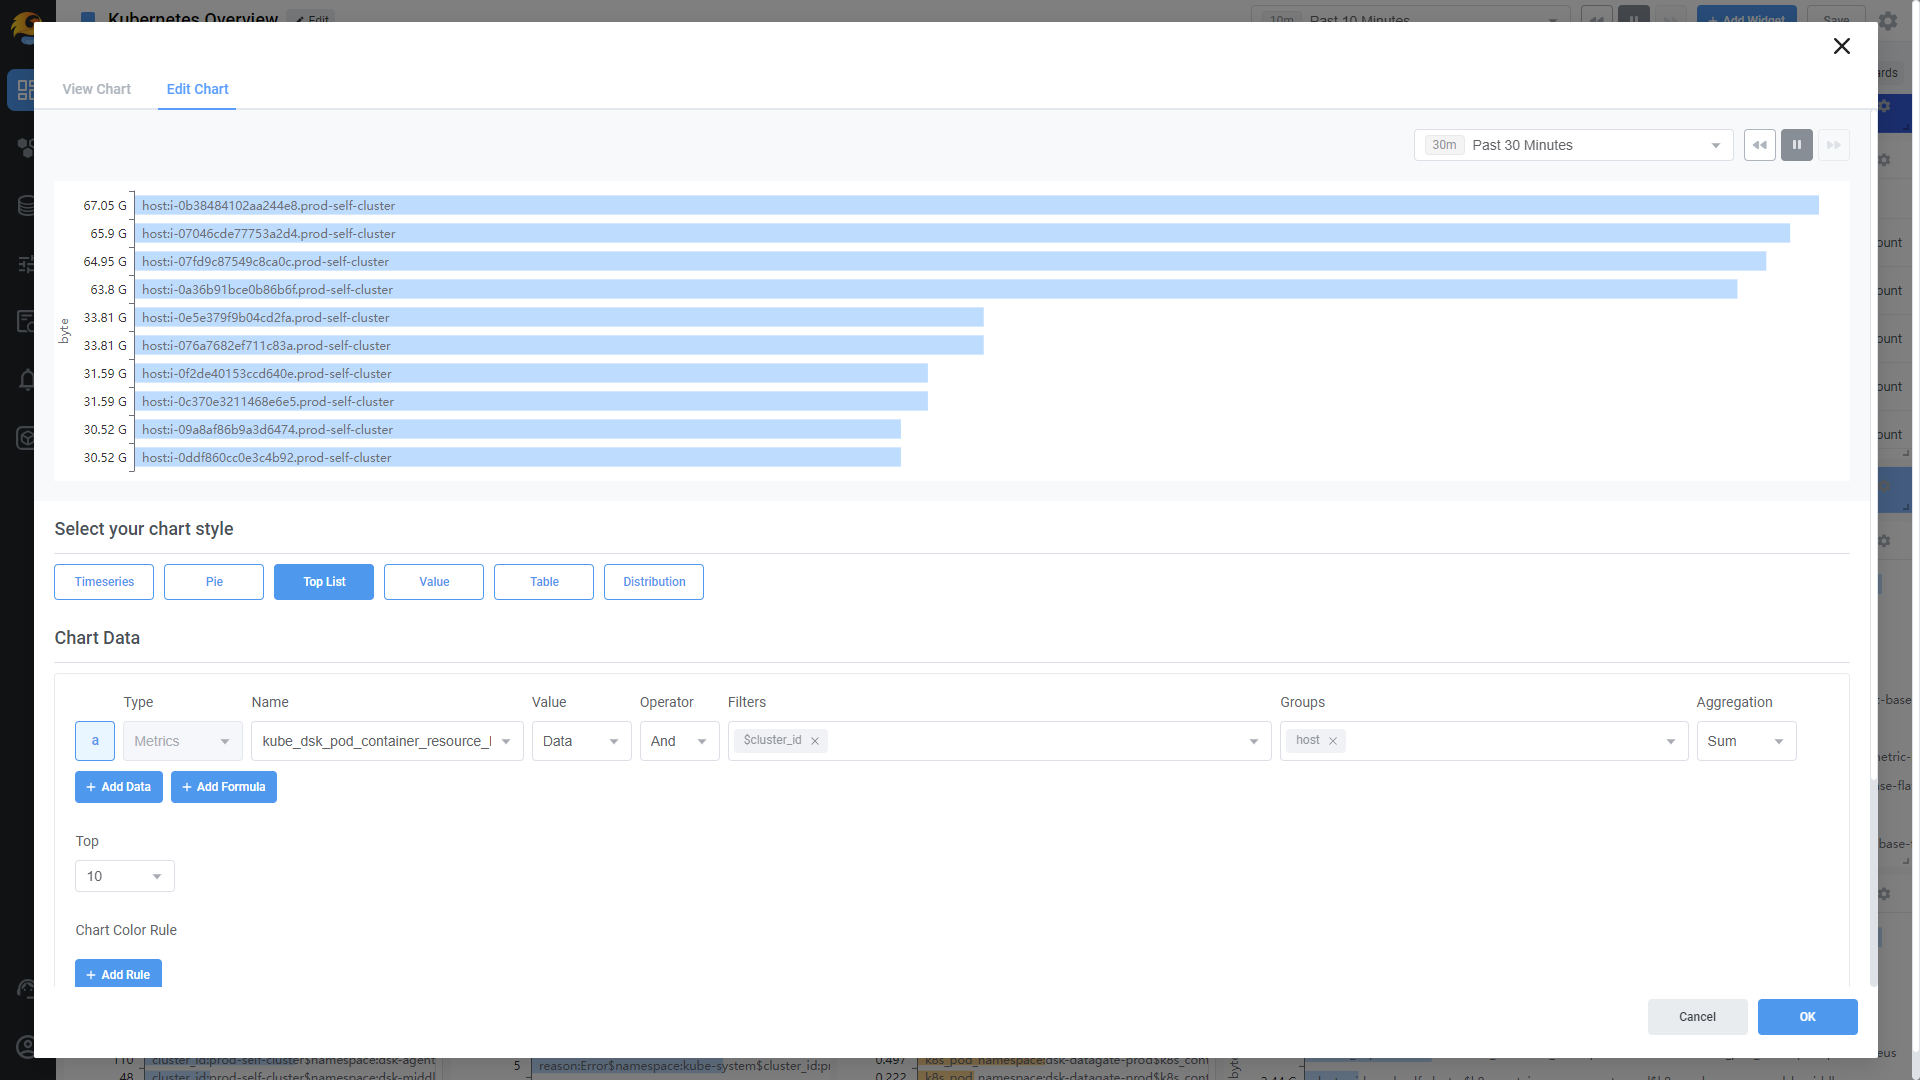
2. Memory Requests on Node
클러스터에 있는 각각의 노드에 부여된 메모리 리소스 Request를 표시합니다.
Dashboard 구성
Chart | Top List | |
Type | Metrics |
|
Value | Data or Last | |
Filters |
| |
Groups |
| |
Aggregation | Sum |
Dashboard 에서 사용한 Metric
Metric Name | kube_dsk_pod_container_resource_requests_cpu |
Type | Gauge |
Description | 컨테이너가 요청하는 Memory 리소스의 양입니다. |
Labels |
|
3. CPU Limit Sum on Node (Core)
클러스터에 있는 각각의 노드에 부여된 CPU 리소스 제한을 표시합니다.
Dashboard 구성
Chart | Top List | |
Type | Metrics |
|
Value | Data or Last | |
Filters |
| |
Groups |
| |
Aggregation | Sum |
Dashboard 에서 사용한 Metric
Metric Name | kube_dsk_pod_container_resource_requests_cpu |
Type | Gauge |
Description | 컨테이너가 사용할 수 있는 최대 CPU 리소스 양입니다. |
Labels |
|
4. Memory Limit Sum on Node
클러스터에 있는 각각의 노드에 부여된 메모리 리소스 제한을 표시합니다.
Dashboard 구성
Chart | Top List | |
Type | Metrics |
|
Value | Data or Last | |
Filters |
| |
Groups |
| |
Aggregation | Sum |
Dashboard 에서 사용한 Metric
Metric Name | kube_dsk_pod_container_resource_limits_memory |
Type | Gauge |
Description | 컨테이너가 사용할 수 있는 최대 메모리 리소스 양입니다. |
Labels |
|
[5] Pod Container Resources
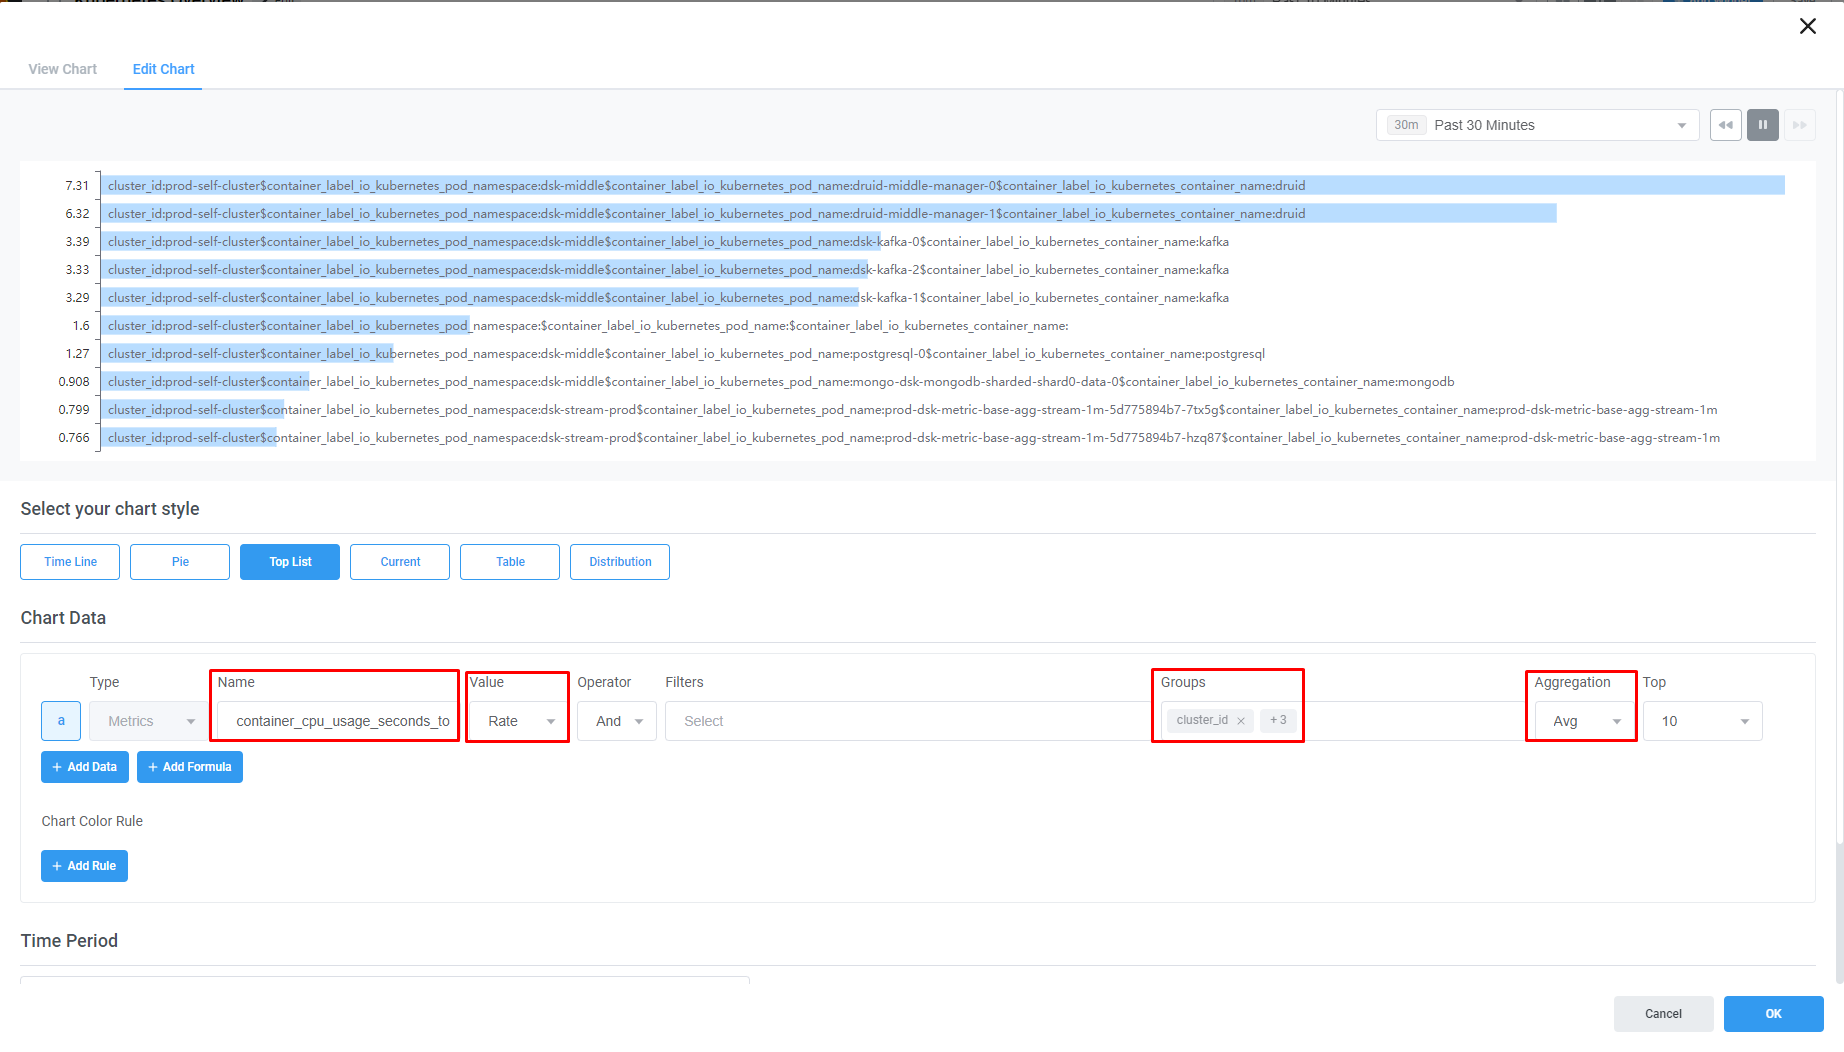
1. Top CPU Intensive container
각 파드 내의 컨테이너들을 CPU 사용량이 높은 순으로 표시합니다.
Dashboard 구성
Chart | Top List | |
Type | Metrics |
|
Value | Rate | |
Filters |
| |
Groups |
| |
Aggregation | Avg |
Dashboard 에서 사용한 Metric
Metric Name | container_cpu_usage_seconds_total |
Type | Counter |
Description | 컨테이너에서 사용된 CPU 시간 측정 값을 나타내며, 컨테이너의 모든 프로세스의 CPU 사용 시간 총합을 나타냄 |
Labels |
|
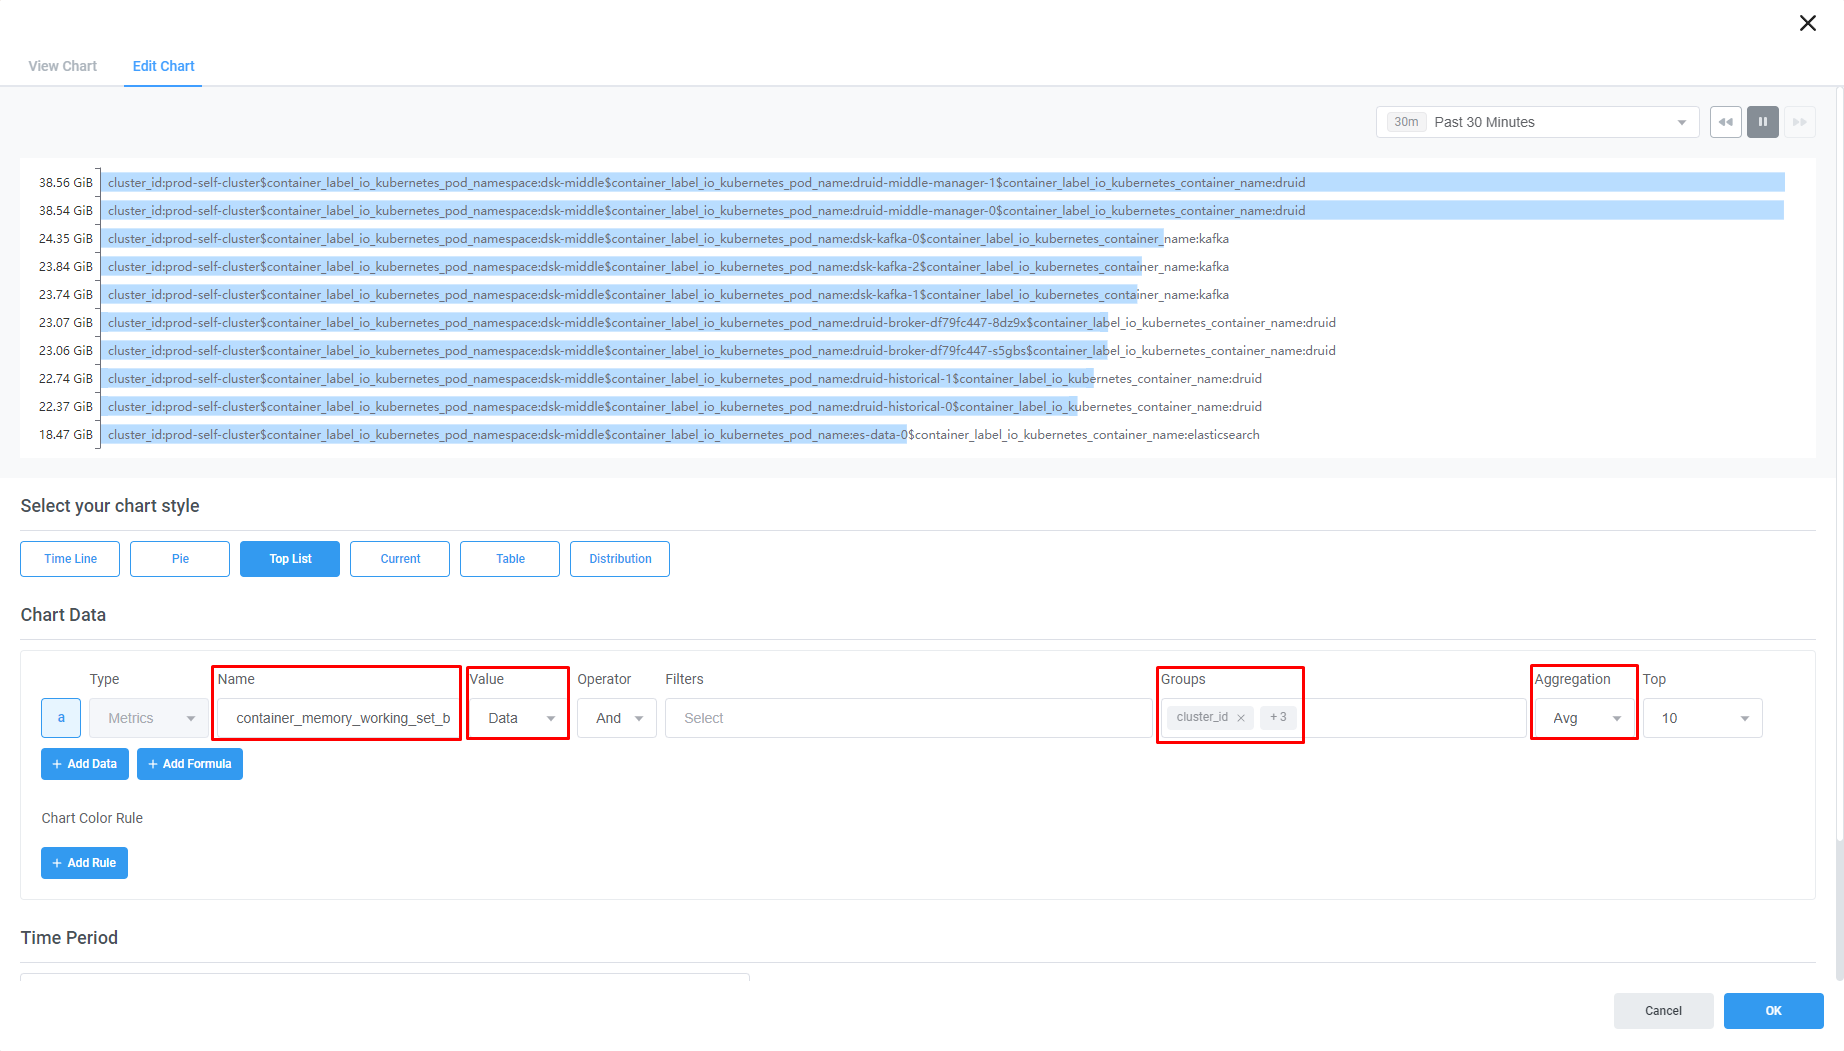
2. Top Memory Intensive Containers
각 파드 내의 컨테이너들을 Memory 사용량이 높은 순으로 표시합니다.
Dashboard 구성
Chart | Top List | |
Type | Metrics |
|
Value | Data | |
Filters |
| |
Groups |
| |
Aggregation | Avg |
Dashboard 에서 사용한 Metric
Metric Name | container_memory_working_set_bytes |
Type | Gauge |
Description | 컨테이너의 작업 메모리 사용량을 바이트 단위로 측정한 값입니다. |
Labels |
|
[6] Pod Container Overview
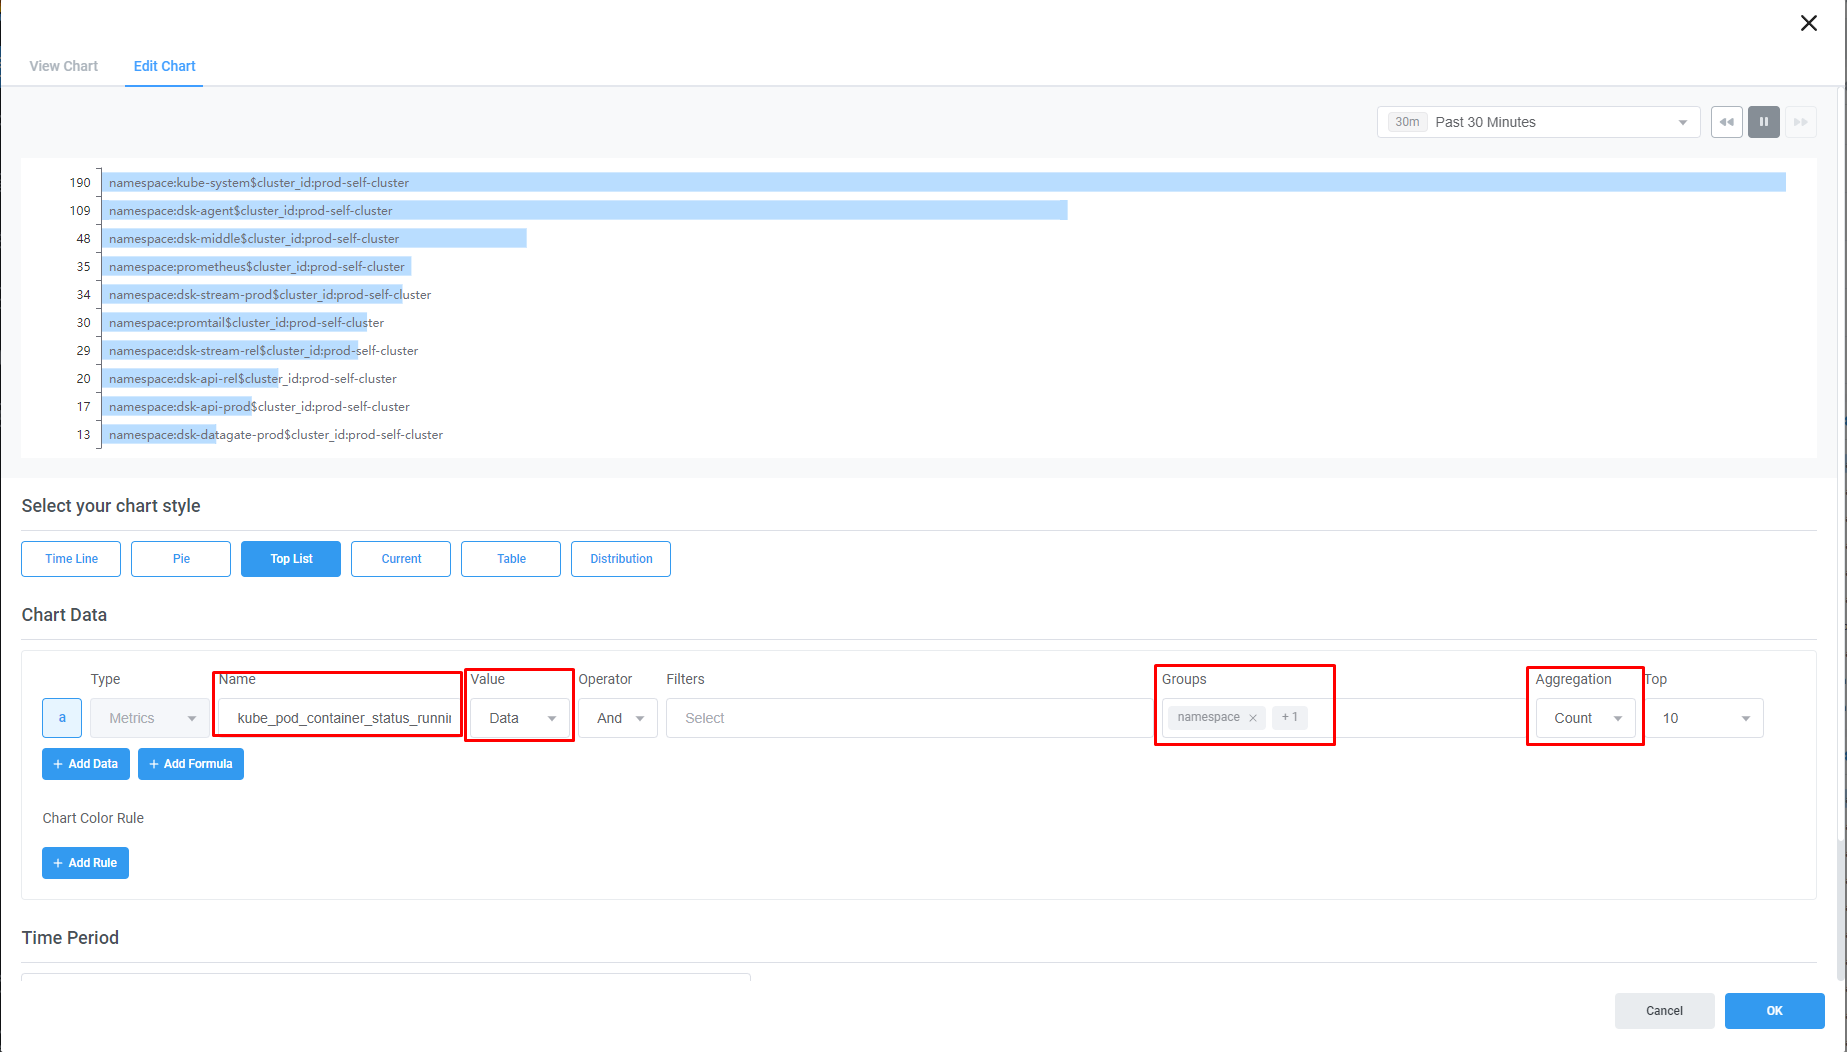
1. Running Container by Namespace
각 네임스페이스를 컨테이너의 개수와 함께 컨테이너가 많은 순으로 표시합니다.
Dashboard 구성
Chart | Top List | |
Type | Metrics |
|
Value | Data or Last | |
Groups |
| |
Aggregation | Count |
Dashboard 에서 사용한 Metric
Metric Name | kube_pod_container_status_running |
Type | Gauge |
Description | 파드의 컨테이너가 실행 중인지 여부를 추적한다. 이 메트릭은 게이지 메트릭이므로 0과 1 사이의 값을 가질 수 있다. 값이 1이면 컨테이너가 실행 중이고, 값이 0이면 컨테이너가 실행 중이 아님을 나타낸다. |
Labels |
|
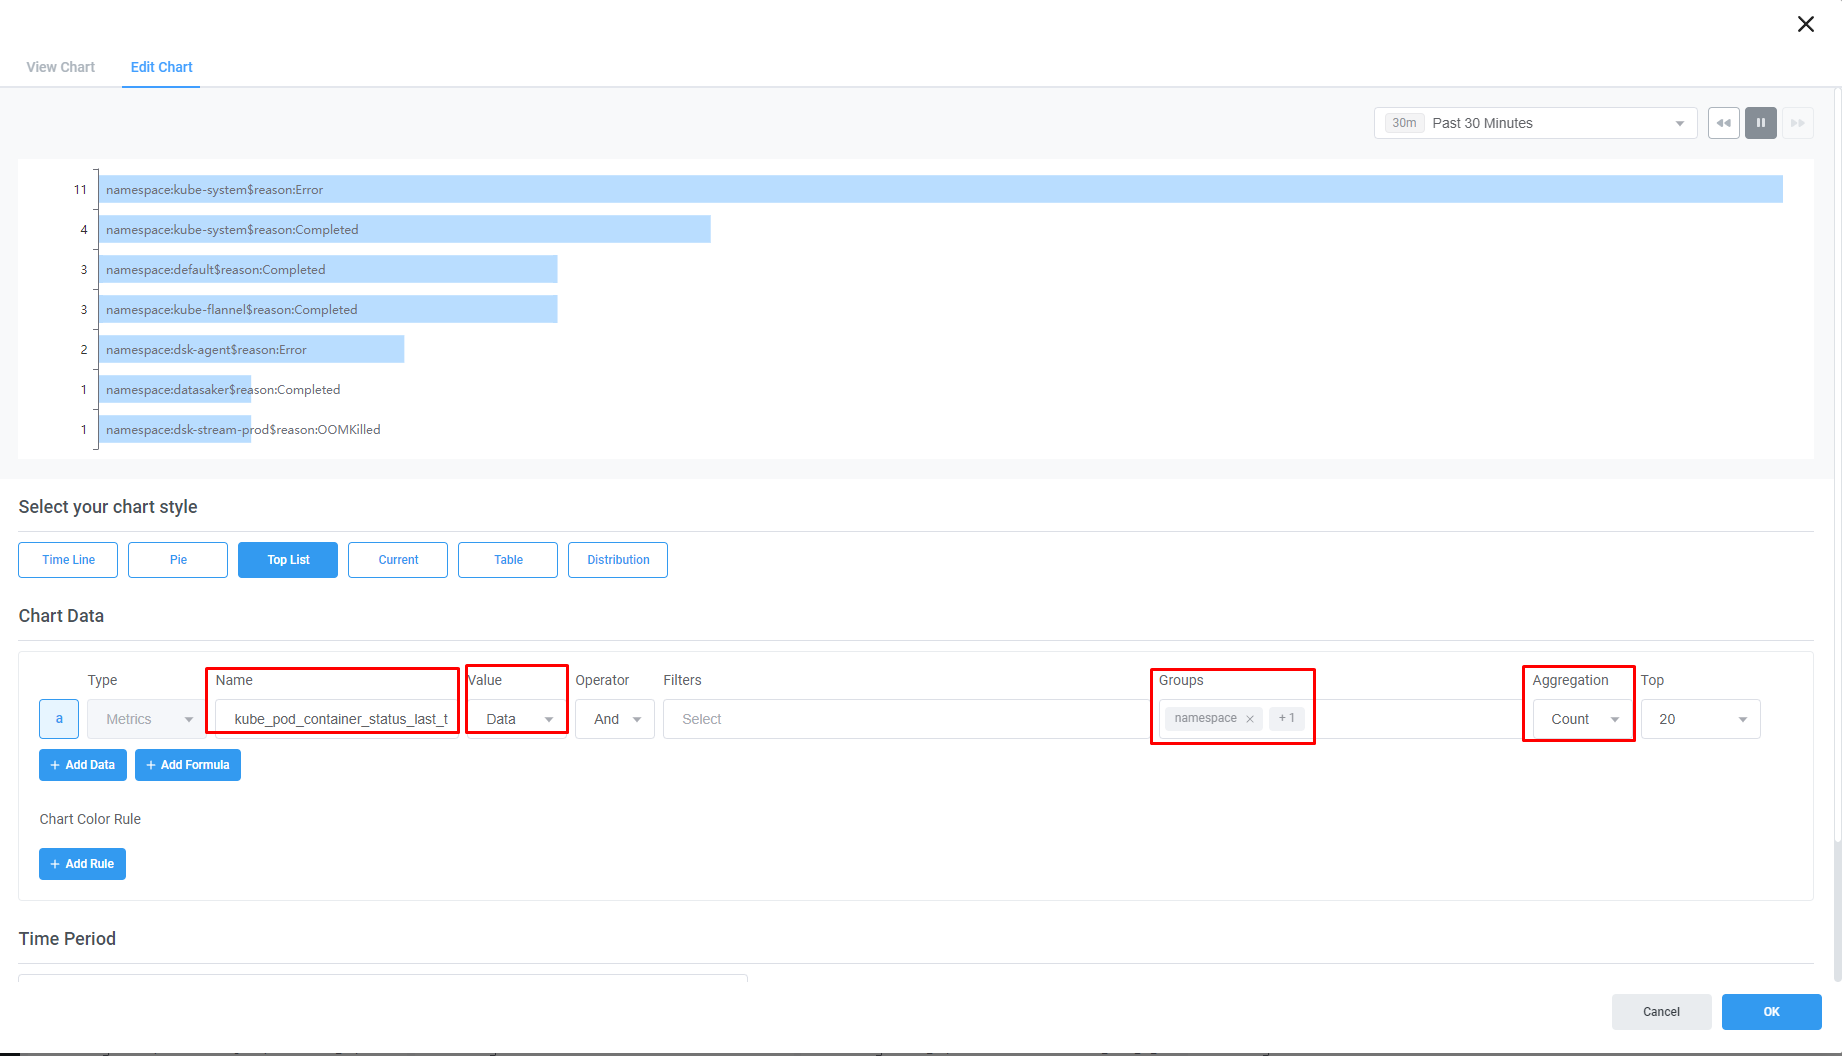
2. Terminated Pod by Namespace, Reason
최근 5분간 종료된 파드들의 네임스페이스, 이유 별 통계를 표시합니다.
Dashboard 구성
Chart | Top List | |
Type | Metrics |
|
Value | Data or Last | |
Groups |
| |
Aggregation | Count |
Dashboard 에서 사용한 Metric
Metric Name | kube_pod_container_status_last_terminated_reason |
Type | Gauge |
Description | 컨테이너의 최근 종료 이유를 reason 라벨로 나타냅니다. |
Labels |
|
3. Top Throttled Containers
CPU 스로틀링된 시간이 가장 긴 컨테이너 순위를 표시합니다.
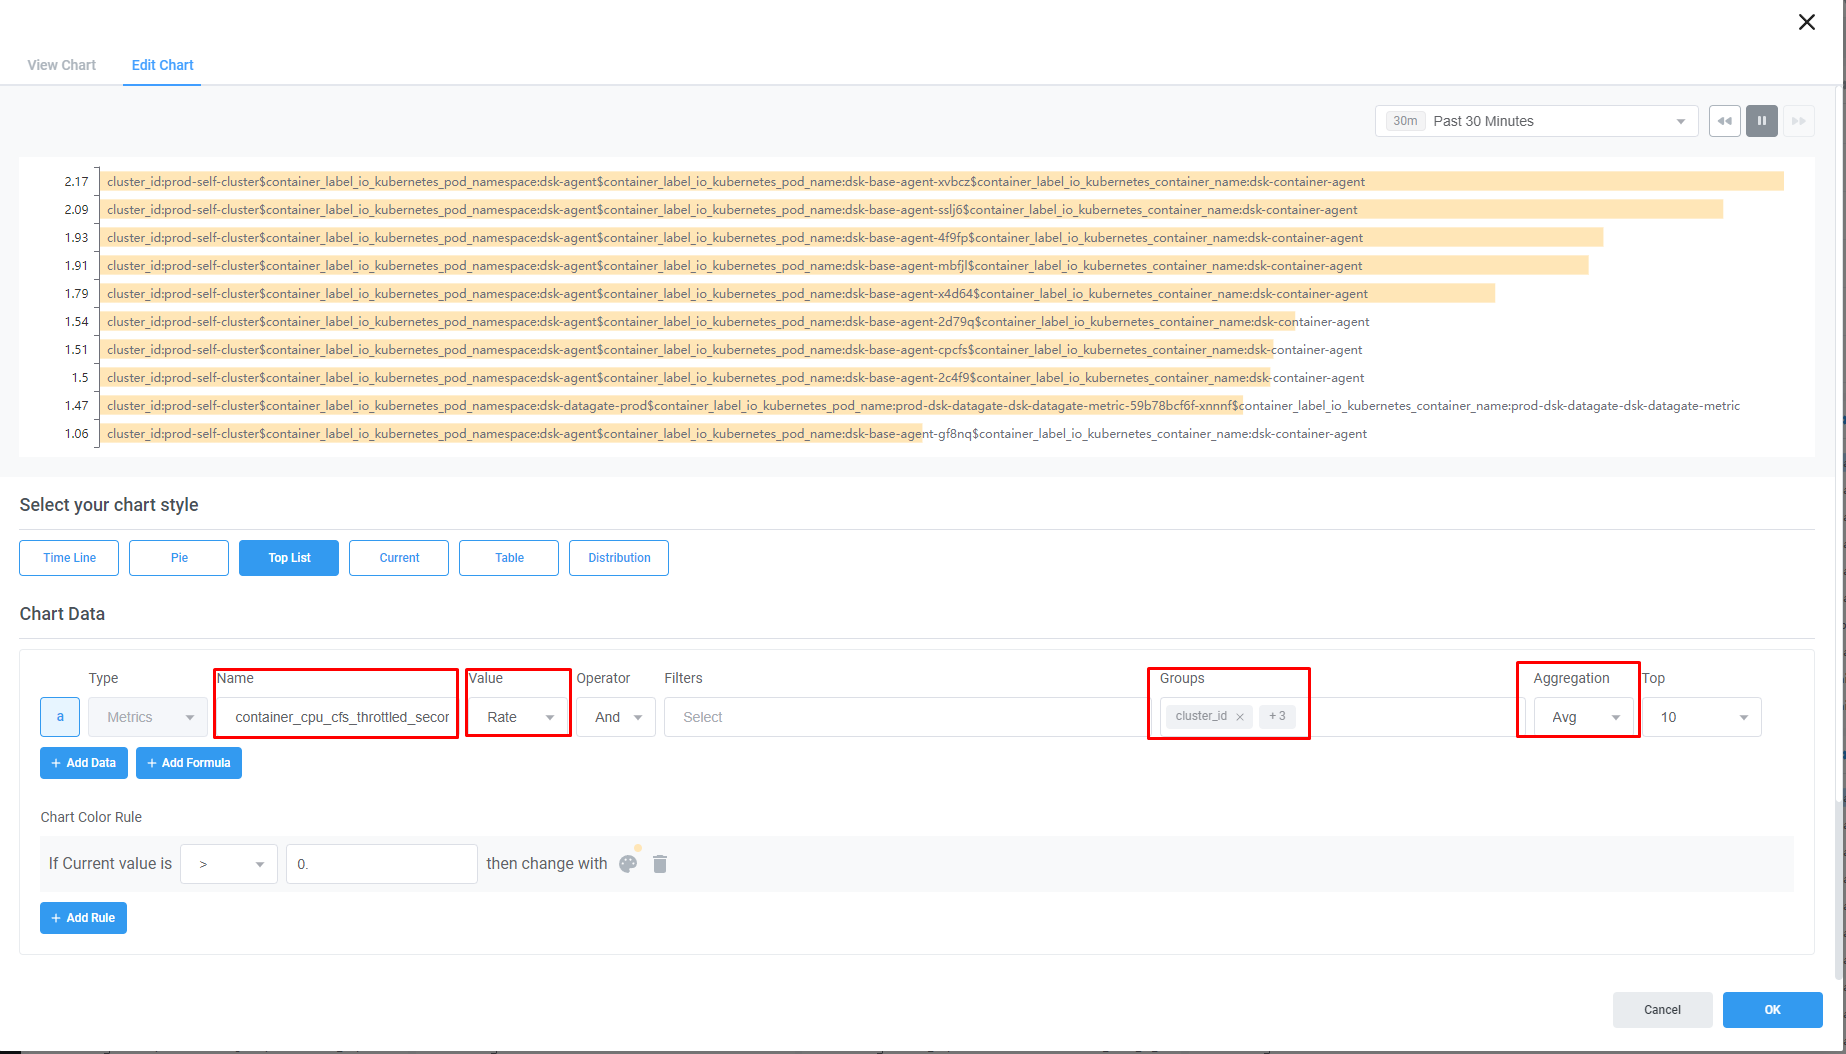
Dashboard 구성
Chart | Top List | |
Type | Metrics |
|
Value | Rate | |
Filters |
| |
Groups |
| |
Aggregation | Avg |
Dashboard 에서 사용한 Metric
Metric Name | container_cpu_cfs_throttled_seconds_total |
Type | Counter |
Description | 컨테이너 환경에서 CFS 알고리즘에 의해 컨테이너의 CPU 사용량이 조절된 총 시간을 추적하는 데 사용되는 성능 측정 지표입니다. |
Labels |
|